Monday, June 18, 2012

Feel the Heat!

From the Miami Heat Website


    You get the idea, but like the team, we will be seeing more of the heat this week. A teleconnection pattern switch will allow for a ridge to engulf the Southeast. At first I thought this was part of the Bermuda high but it is not. Before we focus on our weather, I want to show the Atlantic satellite image. The same cutoff low that I suggested last week that could support a subtropical storm seems to be well, developing into a subtropical storm.


From CIMSS.

With a low/moderate shear environment, marginal water temperatures, the low has a short opportunity to develop into a named (likely subtropical) storm before it races towards the northeast. The storm still has a dependence on the upper level cutoff low but a surface warm core low is beginning to develop underneath it. The system is acquiring tropical characteristics but I believe it will be classified as subtropical, due to the reason stated above.

GIF image of 500mb geopotential height anomalies, from E-Wall (Penn State)

The steady ridge that has been creating a super zonal flow across the eastern Pacific is weakening and the positive height anomaly will subside. This height anomaly along with the negative anomaly to the north will weaken the pressure gradient between the two, and thus, weaken the zonal flow entering into the Pacific Northwest. This isn't necessarily a bad thing though. The super strong zonal flow has pushed right up to the eastern edge of the northern Rockies, and has been the culprit of the lack of precipitation across the Central Rockies. This zonal flow has also kept the polar jet away from the subtropical jet stream, and with the subtropical jet the drought situation across Florida has largely been eradicated.


Zonal flow described above, from Twisterdata.com


Instant Weather Map image of the zonal flow across the eastern Pacific.
This zonal flow across the eastern Pacific will weaken, and instead we get a stronger zonal flow across the northern tier of the United States. With the prior setup, we have had a very strong jet push zonally across the northern Rockies and right up to the eastern crest. With the lack of wave amplitude between the eastern Pacific and the eastern Rockies, the Pacific Northwest has been getting a parade of weaker, but more frequent cyclonic storms. However, with a lack of amplitude across the Rockies, the cyclonic storms encounter the higher terrain and weaken (due to vortex squishing). With the jet exit right at the eastern crest of the mountains, cyclonic storms have been strong coming off the mountains due to vortex stretching. With the peak jet moving farther to the east, the storm track shifts farther to the north. We won't even see frontal activity cross our area until Thursday night.


300mb winds, from instantweathermaps.com


   In the red box is the stronger polar jet flow into the United States and in the yellow box is a building trough associated with an upper level low from the subtropical jet. It is the subtropical jet that has been very beneficial for the Southwest U.S. and will soon provide a huge rain maker for Florida and southern Georgia at the end of this week.

But hang on, are we seeing a ridge building across central Canada in the very last image of the above animation? Yes, and this is in response to higher geopotential heights across eastern Canada and Greenland. If this is starting to become more difficult to understand, don't feel bad because I had to sit and think about this for a while myself.


Surface precipitation (Wednesday) with 1000mb - 500mb height thickness contours (from www.weather.unisys.com)


850mb temperature and pressure contours, from www.weather.unisys.com


The last two images are ugly, with a strong high FIRMLY over the eastern half of the United States. There is enough of a southerly flow in place for isolated convective showers in the afternoon.


500mb height level, Wednesday *very warm*

500mb height level, Friday *still warm*

500mb height level, next week. *Hope?*
 The 3-day and 6-day forecast is bleak, for those like me wishing for a cooler summer. But the end of the model run is encouraging, with a ridge building across both the Midwest and....wait for it....Greenland. The EURO shows this happening a little earlier but is on the same track.


Source: Berlin Stratosphere Group
Verdict - this week = very warm, with highs in the lower/mid 80's. A weak front pushes the temperatures down about 3-5*F on Friday. Another teleconnection shift will favor the reduction of the ridge promoting the hotter weather by next week.

Wednesday, June 13, 2012

Remember the Bean Collection Theory?

About a year and a half ago, I ventured out to West Jefferson to meet with a man about a theory that "foggy days during the summer correlates to the type of winter we have." Not quick to dismiss this, I looked through five years worth of calenders and photographed the pages, to investigate the days later on. The first question that came up was "What constitutes a foggy day?" The second question was "How much fog constitutes a heavy fog day (and thus a larger bean)? There were two limits I put on the "fog" meeting criteria. One, was it a "cool day" fog or a "warm day fog?" Two, was there precipitation associated with the fog? If condition two was met with a "yes" then the day was immediately discarded. Why? Evaporation fog is very commonly found after precipitating events. Precipitation fog is formed by evaporation of water into water vapor. It can also form if warmer air flows over a cooled rain soaked surface and cools to a saturation point.

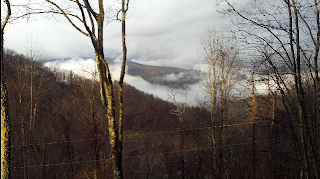
Source: Watauga Road Conditions and Weather


There is also radiation fog, which is fog created when land is cooled after a sunset in a clear and stable atmosphere. This is more commonly found during the winter than the summer. However, valley fog associated with this is not unusual and during the clear, calm (has to have little to no wind), waking up to a morning valley fog is a little more common (still hard to find during the summer).

Precipitation induced fog and calm weather fog have both been ruled out, leaving just two categories. This already ruled out about 40% of the data. One is an orographically forced fog where wind blows up a slope, adiabatically cools to its saturation point, and causes condensation. A majority of the little bean events stemmed during warm days and were from a southerly wind flow. A moisture loaded southerly flow that persists for several days suggests the Bermuda High was involved, and the High Country was positioned around the High's western edge. Not surprising, many of these days also had precipitation from afternoon instability.

The second type of fog was much harder to find. In fact, I could only find TEN examples of it during a 5 year time period. It is a summer time cold air damming event. This fog is noted by a surface high located northeast of the High Country. For it to be a true cold air damming, the high had to be the primary component driving the dam. If there was a low pressure system funneling in cold air, then this was ruled out. A cold air damming event is where sinking air from a high northeast of the High Country funnels in cool, stable, and moist air southwest into the Piedmont. Because the air is so stable, it is unable to sufficiently rise up and over the mountains, thus creating a shallow stratocumulus cloud deck.

Cold air damming fog, from L'Heureux's Weather


Connecting the cold air damming events to the teleconnection patterns did not yield clear results. I was surprised the North Atlantic Oscillation seemed to have no clear connection to summer related cold air damming events but retrospect, it does make sense now. The NAO is calculated as a pressure gradient between the Icelandic Low and the Azores High, both of which are in the central to east Atlantic. A pattern that is more associated with the west Atlantic could be counteracted by the eastern sector and thus nullified in the NAO.

A true cold air damming event, with a low level cloud deck induced by a surface cold dome


There DID seem to be a great positive change of the PNA prior to a damming event but during the summer the role of the PNA is diminished and is no longer connected to events in the Atlantic. However, that study focused on the PNA syncing up with the NAO, and as indicated in the last paragraph, the NAO is focused on the EAST Atlantic. The Northern Annular Mode and North Atlantic Oscillation focus a little more on this but there is still no clear numerical index that represents a sector based North Atlantic Teleconnection Index. We have examples for ENSO, such as Nino 1, Nino 2, Nino 3, Nino 3.4 and Nino 4. For NAO, we have one universal index representing the basin instead of a sector oriented NAO index (west NAO, central NAO, eastern NAO). The index is generally sufficient because one would not expect to see strong geopotential height anomalies persist in an area and have it be confined to a small sector.


NAO height anomalies, from the Climate Prediction Center
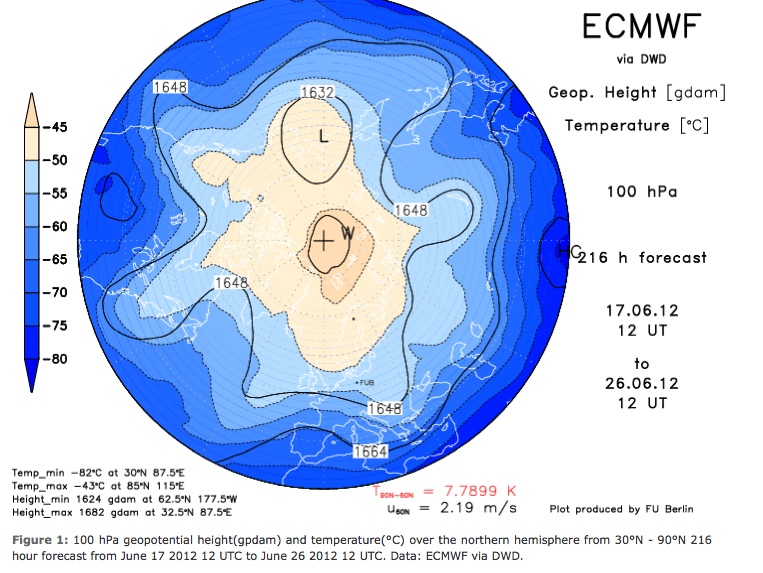
Geopotential Height Anomalies for summer cold air damming events

   The low anomaly off the Carolina coast is from low pressure systems attached to a backdoor cold front. The high pressure off of southeast Canada is what I am really interested in, as this is our source of the cold air being funneled into the southeast.


Surface winds for a true cold air damming event


And just to make sure my sample means are true cold air damming events, the instability needs to be really low, since the air mass involved is very stable.


 And to drive the point home, the percentage of low cloud cover. The numbers should drop rapidly just west of the Blue Ridge, and they do!


 And just to prove that there is surface fog....the surface relative humidity.


But how does the fog actually stack up to pre-existing indices? Not well at all. If we took the BEST correlated index, the PNA, the results are less than stellar. The June - August PNA correlates rather poorly to the height levels over the High Country over the winter. It does translate better for the interior of Canada, southeast Canada, and the southwest but the anomaly over the west Atlantic can be discarded, due to a poorly linked PNA pattern to height levels across the Atlantic during the summer. However, there is no sector on this map that passes a 95% confidence interval. The positive values mean that the higher the index number, the higher the pressure in the winter. The negative values mean that the lower the index number, the higher the pressure in the winter. This would suggest a positive PNA, exactly the opposite found for the summer cold air damming events, would be more conducive for a cooler winter. Again, I am really questioning anything outside of central Canada due to the lack of a PNA influence on the Atlantic during the summer.

PNA summer correlation to winter geopotential heights


The NAO actually does worse, with no discernible correlation to ANYTHING located within its sector. However, there is one thing to note: the negative anomaly over southeast Canada (suggesting that a negative NAO would result to higher height levels). Again the correlation coefficient fails the 95% confidence interval. And since there was no clear relationship of the NAO to the cold air damming events, this has to be ruled out.
NAO summer correlation to winter geopotential heights


And this plot above fails the winter test. The summer of 2011 was largely a negative NAO yet the winter was absurdly warm. A big culprit was a NEGATIVE height anomaly over southeast Canada, and the correlation plot has that completely wrong.  At least the plot correctly shows that a positive phase NAO increases the strength of the southerly flow during the summer. And it is the positive NAO phase that likely led to the majority of the light orographic morning fog events (little beans).

NAO correlation to winds


The weak positive ENSO this summer and the negative Pacific Decadal Oscillation have largely canceled out one another.

Conclusion: Even constricting the foggy days, there is no clear link to the foggy days in the summer and severity of the winter, let alone to the number of winter storms. When focusing on "cold foggy" or "warm foggy" (cold air damming and moist southerly flow), neither had an impact on the winter. Cold air damming events were not influenced by the NAO phase and the important sector that the PNA influenced was questionable. Both the negative NAO and negative PNA influenced an interesting sector, and that would be Southeast Canada. But the lack of any empirical evidence all but rules out the idea that foggy days correlate to winter storm frequency.

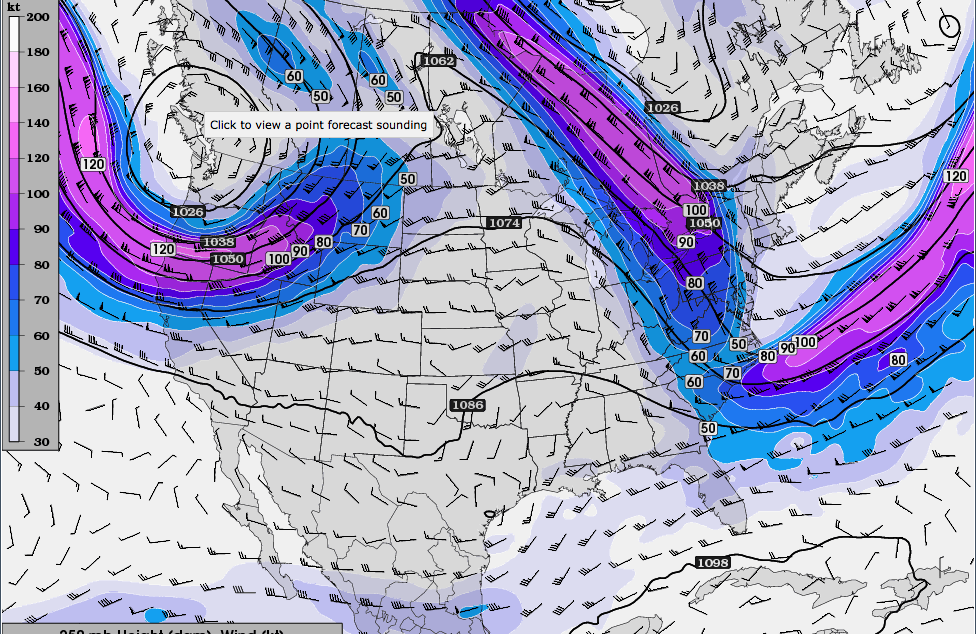
For current forecasts though, remember how the negative PNA seemed to favor cold air damming events during the summer? Bingo. The plots below are for Friday, and this is a true cold air damming event because the northeast wind flow is confined to a low level. Saturday will not be a true damming event as the same ridge will actually be pushed towards the southwest and we will soon be enveloped by a trough.


One more thing. This surface low off the coast of South Carolina intrigues me. We have already had two named tropical storms this season form from the same type of system. Will that low be our third? My thought - the frontal boundary sits in place for several days with shear values lessening. It has an opportunity to become subtropical before it rushes to the northeast into the Atlantic by the middle of next week.
www.weather.unisys 500mb heights (color) and surface pressure contours.

www.weather.unisys 1000mb level wind and temperatures


Friday, June 8, 2012

General Weekend Forecast

The map above (from CIMSS) shows the shear tendency and total tropospheric wind shear. We can actually see both the polar jet and the subtropical jet. The environment is just too hostile right now to support tropical cyclone activity.


 It would be an understatement saying there is a lot of rainfall coming next week, but when (and why)? As this lovely map above shows, the bulk of the rainfall will be confined to the Gulf Coast and areas to the west of the Carolinas. Here is a map of the upper level low that will eventually act as kerosene on a burning fire for storm activity.
The upper level low is over Texas on Sunday (300mb level winds, from www.weather.unisys.com)

And the 500mb vorticity for Sunday, from www.weather.unisys.com


Saturday still has a very strong dry layer aloft, which all but crushes rainfall chances across the Carolinas. Note the pre-existing upper level high across south Florida and the moisture plume aloft it is carrying towards the Gulf States.
Saturday's 500mb moisture content
The charts on unisys do not make it clear but the upper level low over Texas eventually drops down towards the Gulf Coast as a trough in the northerly branch of the jet stream deepens. This trough deepens as it traverses down the Rockies. This stretches out the upper level low component to it, contracting the trough and making a more favorable environment downstream. The upper Midwest will have a stormy day on Sunday. The deepening trough will shunt the southern branch farther south as well. Thus, even Sunday is precipitation free for the Piedmont but we will see the cloud cover roll in. There is a chance of a popup shower in the Mountains on Sunday.
Sunday's 300mb winds
 While the precipitation is confined to the southern states on Sunday, a now synoptically supported upper level flow in conjunction with a surface moisture flow off the Gulf will REALLY enhance thunderstorm activity across the Gulf Coast. Now, we have a very long line of thunderstorm and rain activity extending along the Mississippi River.

Sunday's upper level relative humidity.

With the deepening trough for the northern branch of the jet stream, the moisture plume from the upper level low over the Gulf Coast (and from the southern jet) are both carried much farther into the United States.
Sunday's 500mb vorticity
The subtropical jet will provide additional moisture on Monday. Hence, this is the kerosene on the fire and when we will start to see our rainfall and thunderstorms. I think the model output has the rainfall as too high, but I can see between a half inch and 3/4" for Monday alone.


Monday 300mb winds
 The precipitation doesn't make it into the Piedmont until Monday morning. I think the models are pinging too high a rainfall amount but I do support the end result of there 1-2" up to Wednesday.

Monday upper level relative humidity

Tuesday upper level humidity

Thursday, June 7, 2012

An end to the drought?


 Well, an end to the drought doesn't apply for the High Country, due to the nitro charged storm track we had from this winter. This winter, we had a very strong anomalous low over Alaska and another over Greenland. The low over Alaska induced a more zonal flow across the United States, and the low over Greenland aided in keeping a ridge over the Southeast. In fact, except for a two week break, this same pattern held up all winter.

January - March 2012 Geopotential height anomalies. Red = higher heights (warm areas) blue = lower heights (colder areas).
This bears no resemblance to the 2010-2011 and 2009-2010 winters. A supercharged jet stream entering into the Pacific Northwest means a very flat, zonal storm track across the United States. The few times there were short waves embedded within the flatter track, they would detach from the track as a cutoff low and drift towards the southwest U.S. That is really the only reason why we do not see as strong of a positive anomaly across the southwest United States.

The strong ridge across the Pacific and the strong trough over Alaska induced a strong pressure gradient, strengthening the jet here (due to the steeper gradient change).
 

The mean jet stream from January 2012 to March 2012. Notice the anomalously strong jet over the Pacific Northwest, and how it penetrates across the northern states. The jet actually isn't weaker across the central United States. Rather, it is descending down to another level. Across the east coast it rises back up to that level. See how the highest values are well off the east coast and do not pass over the Southeast? Lets look at the prior winters.


 The Armageddon winter of 2009 - 2010. The storm track has been pushed much farther south, to the point where the Southeast was almost always in a perpetual trough. Also look at the absence of a strong jet stream entering into the Pacific Northwest.

 The much more benign winter of 2010-2011, which had a brutal start but a slow finish. The jet stream entering the Pacific Northwest is stronger but not nearly as strong as this prior winter. Most of the strong values over the Southeast are from December 2010 alone. That's how far south the trough was during that winter.


We can see how strong the current negative phase of the North Atlantic Oscillation is right now. The stronger it is, the more zonal the flow is across the Atlantic.


Enough reminiscing about the past, lets get to the meat of the forecast. A split in the primary jet stream will put the High Country in between the storm tracks. A building upper level ridge this weekend will keep the area sunny to partly cloudy and displace the trough that has been keeping the High Country in unseasonably cool weather. The polar and subtropical jet stream are both defined, unlike last summer where the subtropical jet stream was heavily suppressed. The subtropical jet stream is weaker, and found at a higher height level due to the warmer (and thicker) atmosphere. The end result of a trough of the southerly jet is below.

The next 3 figures are winds at the 250mb level.


Friday winds. The backside of the trough will funnel in remnant cold air in the morning but I am expecting a wind shift tomorrow. Rainfall is confined to the eastern Gulf Coast and Florida.


Saturday winds. Notice the slight colors at the bottom of the figure. This is actually the southern branch of the jet, augmented by the lack of a strong zonal flow into the Pacific Northwest. Notice the building trough across the southern jet. At this point the rainfall will be confined to the Gulf Coast, due to the close proximity of the descending portion of the northern jet stream.

Sunday winds. Stronger southern jet flow and building trough in the southern jet will support slight synoptic ascent across Florida, Georgia, and southeast South Carolina. Rainfall will be here.
Positive geopotential heights over Greenland and the Arctic are inducing the expansion of cooler weather across the East Coast. Weaker polar jet is allowing for a southerly branch to have some weight in this forecast.

We have a retreat of the higher pressure over the Arctic, and with that the cooler weather retreats as well. We start to see a building ridge across the Great Lakes Region. This is not a deep ridge nor is this ridge linked to the Bermuda high but is an upper level ridge.
I am actually looking up at the sky thanking God for this ridge having no connection to the Bermuda High. The Bermuda high has been confined to the eastern Atlantic, and thus has confined what made last summer brutally hot. With an expanded Bermuda High (called a "Death Ridge"), the storm track is shunted well to our north and a ring of convection forms along the western periphery of the ridge. The High Country and the rest of the southeast are stuck in a very warm, humid weather pattern that remains in a steady state for weeks at a time and only isolated convective activity provides rainfall.

Looking ahead, I see an expansion/contraction of the Bermuda High but no sign of there being a steady state Bermuda High extending over the Southeast. Rather, a welcoming southerly jet will keep Florida and the Gulf Coast in a wetter weather pattern, and this may occasionally encompass Georgia and the Carolinas with it. The northerly branch will not envelop the High Country with NEARLY as much frequency but it's proximity, along with the southern branch, will keep the High Country in a more consistent temperature pattern than last summer.

Verdict: The next several weeks continue the wet and mild weather pattern. Hot weather will not be able to get a foothold over the Southeast and precipitation will be abundant.


Tuesday, June 5, 2012

Forecast for 06/05/12

Today's Relative Humidity with wind data (from twisterdata.com)

Phew. The past few days have been tumultuous but I am back with a comprehensive forecast. A cold-soon-to-be-stationary front keeps drifting towards the Gulf Coast. The High Country has only the slightest threat of a shower today, from very weak convergence on both sides of the mountains (from a northerly wind flow). However, the air remains moisture deprived and with a lack of synoptic support and local instability, the shower threat is extremely minimal today. One would have to go south of the NC/SC border to find showers and south of I-20 to find any real storm activity today.

Tonight the easterly flow picks up from a weak high pressure offshore. With the surface relative humidity rising quickly, I can see fog and drizzle developing along the Blue Ridge and Foothills. Tomorrow will actually be cooler than today.

Relative humidity for early tonight with a strengthening easterly flow....
And the saturation by midnight


Highs will not be getting out of the 60's tomorrow.

My tornado index is highlighting Montana as a source of tornadic activity today (not much). This suggests 1)low number of tornadoes (likely), 2)weak tornadoes (likely) 3)short tracking tornadoes (also likely). But what about that small chance over eastern Georgia? Why isn't my index showing this as an area? It is, but the tornado damage potential it is showing for that region is 1)ranked very low compared to other events 2)short lived nature of squall line induced tornadoes or short lived, isolated tornadoes (less than 5) are not represented as well. There are far more conditions which are conducive for an isolated tornado rather than an outbreak. An outbreak is far more likely to be linked to a teleconnection pattern or a favorable synoptic pattern (the case for Montana today).

Storm prediction center tornado probability for today
The case for eastern Georgia is that this is near where a weak southerly branch of the jet stream is merging with a far stronger northern branch. The jet is lower to the ground across eastern Georgia and has a better shear environment. Shear is good as it allows horizontal vorticity to be tilted into the vertical.

Since this is also where the frontal boundary will be today, this is a better environment for strong convective storm formation and for squall lines.

Damaging wind probability for today (storm prediction center)

Friday, June 1, 2012

Tornado Outbreak Potential Index


This product is "Patent pending" and has already secured myself, John Michael L'Heureux, as the inventor of this product. Dr. Ryan Boyles and Dr. Chip Konrad have been credited for their contribution to this project. This new method of measuring tornado outbreak potential will not be described in detail until after the patent has been approved. The index is not designed to replace what is in place, but is designed to augment current forecasts. Due to the methods used to compile this index, I consider this a more effective product for designating the damage of a tornado outbreak.

This is my fourth test run of my tornadic damage potential index. I have produced a plot below, depicting the ideal geopotential height anomalies found for tornadic activity for the Mid-Atlantic. Note that my index does not rank the outbreaks by number of tornadoes alone but weighs several criteria. The index normalizes the damage potential from 1950 - 2010 and no longer treats earlier dates as being less significant for tornadic activity.  Note that due to the other new index I am using, dates I constitute to be significant may not be significant in any other analysis (and vice versa). For example, my index treats "29 F0 tornadoes" as being different than "29 F3 tornadoes" and ranks the damage potential accordingly.
NCEP/NCAR figure for historical "most ideal scenario" for tornadic activity for Virginia, Maryland, eastern West Virginia, southeast Pennsylvania, Delaware, and southwest New Jersey.
 The next plot shows the actual geopotential height anomalies for today (red = higher than usual, blue = lower than usual). Note that the two plots are not a carbon copy match, and deviations from the ideal state gave a low tornado outbreak damage potential for the Mid-Atlantic for today. This means that 1)few tornadoes 2)weak tornadoes 3)short tracked tornadoes) are contributing to the low number. Still, having ANY damage potential for the Mid-Atlantic during the month of May is uncommon.
Actual geopotential height anomalies for today
And the third plot, which shows the current watches/warnings for the Mid-Atlantic.
Current tornado warnings (red polygons) as of 4PM eastern time