Hi everyone. In this thread is the official L'Heureux's Weather 2013-2014 winter forecast. I have a better understanding of more weather/sea surface temperature patterns this year, and will use this increased understanding towards this forecast. In this thread, I will be giving brief summaries of each of these patterns and how these patterns will influence the overall weather pattern this winter.
El Nino/La Nina/La Nada
The
El Niño Southern Oscillation (ENSO) influences the global upper atmospheric winter circulation and cyclone tracks associated with them. During a
neutral phase, upwelling of cold water along the Peru-Humboldt current occurs
off the west coast of South America. Warmer water found in the western
Pacific Ocean is normally about 8°C greater than the eastern Pacific
Ocean. A La Niña event is defined when the 5 month mean of SST
anomalies is less than -.5°C and an El Niño event occurs when there is 6 months
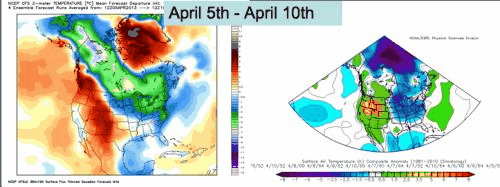
of above .5°C in the western and central Pacific. When this area is in a "normal" phase, we call this a "La Nada". The sea surface temperature patterns of a la nada event can be seen in figure 1 below.

During
El Niño, the trade winds relax in the central and western Pacific and sometimes
reverse leading to an area of low pressure in the eastern Pacific and an area
of higher pressure in the western Pacific. Upwelling of cooler water to
the surface in the Humboldt Current slows down or cuts off completely. The sea surface temperature patterns of an el nino event can be seen in figure 2 below.
In a La Niña event, the Eastern Pacific is cooler than usual, and the cool
water extends farther westward than average. More upwelling of cooler
water occurs in the Humboldt Current. This enhances the Walker
circulation across the equatorial Pacific regions. El Niño and La Niña
are opposite phases of the El Niño-Southern Oscillation (ENSO) cycle, with La
Niña sometimes referred to as the cold phase of ENSO and El Niño as the warm
phase of ENSO.

A La Nina has the effect of making the northern half of the United States colder and the southern half warmer. An El nino has the opposite effect. Strong la nina winters tend to favor warmer weather across the southeast, but not always. A La Nina will cause a greater deal of "buckling" of the jet stream, causing a larger temperature swing throughout winter and leaves for a more inconsistent winter. An El Nino has a split storm track; the polar jet stream and the subtropical jet stream. Strong El Nino winters have a very slight cooling effect on the Southeast and a warming trend for the northern half of the country. The cooling effect on the Southeast may be driven more by the higher degree of precipitation. Because of the buckling in a La Nina, warm periods tend to be warmer and cold blasts tend to be more intense when they come. El Nino winters have a "dampening" effect on this temperature swing!

A La nina sets up a wetter pattern across the Ohio River Valley and the Pacific Northwest, and leaves the southern tier of the United States (particularly the southeast) in a dry spell. An El Nino favors much wetter winter for us in the southeast. If a La Nina winter favors "quality over quantity" for storms: i.e, stronger but fewer storms, an El Nino winter favors a greater quantity of weaker storms.
A La Nada scenario has a diminished impact on the weather pattern, and leaves the door open for other patterns to dominate.
The Pacific Decadal Oscillation
The El Nino Modoki
The North Atlantic Oscillation
The Arctic Oscillation
The Pacific North American Connection
The Polar Vortex
The East Pacific Oscillation
The West Pacific Oscillation
The Madden-Julian Oscillation
The Atlantic Meridional Mode
Pair this with the Pacific Decadal Oscillation and you explain a big chunk of the global warming argument.
The Quasi-Biennial Oscillation
The Indian Dipole Anomaly
The Snow Advance Index
Mountain Torque Events
Sunspot count/Solar activity


.gif)


