Monday, January 14, 2013

Archived Winter Forecast, 2013/01/14


Enjoy the 30 day sample forecast (experimental)! Although this source is free to use, please use proper citation if this data is being redistributed.
The 500-mb height anomaly. Blue = cold, red = warm. If you are south of the snowflake, rainfall is the most probable precipitation type. If you are inside the snowflake, good news, this is your rain/snow line. If you are just north of the snowflake, better news for snowfall.
  = Probable location of snowfall
= Likely warm anomaly

Want to be able to forecast the weather or know what it is doing far in advance? Welcome to the archive winter forecast, or better known as the "Most similar winters" forecast technique. This approach uses the most similar winters in the past to forecast what will happen with this current winter. I look for winters that had a similar pattern leading into the winter and a similar pattern in the winter before I put them together. The index was originally put together October 29th, 2012, with a modification on November 15th. Since then, what you see is unchanged since November 15th.

So what is this animation showing? It shows how high up you must fly to find an air pressure equivalent of 500 millibars. A blue spot means that height level is lower than it should be, suggesting cold air underneath. A red spot suggests the height level is higher than it should be, suggesting warm air underneath. The snowflakes highlight probable locations for snowfall while the blowtorch is an area that has temperatures way above average.

Please note that because this is historical data, not directly modeled forecast data, the sample animation is likely to be off 1-3 days in some parts. Additional error may arise from a "+" anomaly one year canceling out a "-" anomaly that appeared the next year.  This tool is recommended to be used to assist in forecasting, not to be a sole source for forecasting.

You can read the "Version 1" winter forecast here
http://lheureuxsweather.blogspot.com/2012/10/october-winter-forecast-update.html
And the "Version 2" here
http://lheureuxsweather.blogspot.com/2012/11/november-winter-forecast-update.html
To see what changes I have made (and the line of thought I had). Snow maps for the most similar archived winters can be found here.
http://lheureuxsweather.blogspot.com/2012/11/most-similar-winters.html

Friday, December 28, 2012

12/28/12 Forecast Update

Type of precipitation (green = rain, red = freezing rain, purple = sleet, blue = snow)
UPDATE*** Please, please be careful driving tonight and tomorrow. This snow coming in will be partially melted when it hits the ground, forming a higher density (8:1 ratio instead of 10:1) slushy accumulation. Coupled with sleet, freezing rain, and eventually all snow, untreated surfaces will be very slick.
The amount of dry air in the mid levels this afternoon and evening may be the difference maker tonight in terms of what type of precipitation we see. My thoughts are this: the High Country will see a mix of rain/fat melted snowflakes to start this event (possibly starting as just rain for the foothills north of HWY 18). The degree of evaporative cooling and the precipitation rate will play a large role in determining what kind of precipitation falls. Watch the radar tonight: when a "darker" signature (heavier precipitation) shows up over you, watch the precipitation change to wet snowflakes. Evaporative cooling will cool down the surface enough to keep this as a mostly frozen mix through early Saturday morning however the precipitation rate is not high enough to keep it at all snow. Prevailing warm air aloft will create a mixed precipitation even through the night. Saturday morning does transition to all snow showers. Snow accumulations through Saturday are at just 1-3" max (dusting to 1" for foothills), with a 0.15" ice accretion total.  I am concerned about the higher ice accretions for the interior valley regions and for the eastern slopes.

   
Percent of frozen precipitation

Saturday evening a cold front pushes through with a short but concentrated burst of northwest flow snow showers. Another 1-2" max (up to 3" for high peaks along the NC/TN line) is expected. We are expecting a 2-4" grand total of snowfall.

Sunday, December 23, 2012

An Introduction to the Stratosphere

About every third post on the weather page I write something about a stratospheric circulation pattern but have yet to go into full detail about what it is that I am taking about. I have mentioned the ramifications but not the underlying processes. Well, we're about to dive into "stratosphere 101".

The Polar Vortex
The polar vortex is a persistent large-scale cyclonic circulation pattern in the middle and upper troposphere and the stratosphere, centered around the polar regions. It strengthens when the temperature gradient when the stratosphere over the mid-latitude is warm and the stratosphere over the polar regions is cold. The explanation from the Atmospheric and Environmental Research Center (AER) is the best one I can find.

"Strong Polar Vortex
 
Strong is the more common state of the polar vortex. When the polar vortex is strong, this creates strong low pressure in the Arctic region.  Because of the pressure difference between the Arctic and mid-latitudes, air flows into low pressure and this confines the cold air to high latitudes closer to the Arctic. Therefore it is often mild across the Eastern US, Europe and East Asia during winters when the polar vortex is strong.


Weak Polar Vortex

When the polar vortex is weak or “perturbed”, the flow of air is weaker and meanders north and south (rather than west to east). This allows a redistribution of air masses where cold air from the Arctic spills into the mid-latitudes and warm air from the subtropics is carried into the Arctic. This mixing of air masses also favors more storms and snow in the mid-latitudes. Air flows away from the high pressure Arctic. The north to south direction of the polar vortex carries cold Arctic air into the mid-latitudes of Eastern US, Europe and East Asia. Therefore it is cold across the Eastern US, Europe and East Asia during winters when the polar vortex is weak."


Monday, December 3, 2012

Where's Our Snow?


Temperature anomalies (in Celsius). Very cold less than -3*C, Cold is between -1*C and -3*C, near normal between -1*C and +1*C, Warm is between +1*C and +3*C, very warm is greater than +3*C
 Thankfully once we get out of the first 2/3 of December, we do not see predominant warm anomalies showing up until the end of February. Is this a repeat of last winter, which brought unusual warmth and a lack of snow? The short answer is no. A weak El Nino in the Pacific exists where there was not one last year. The Stratosphere above the Arctic is warming rapidly whereas last year there was no sign of this. A colder stratosphere above the Arctic means a warmer winter for us across the Southeast. The recent spike and the pattern that will take place over the next two weeks will keep this trend into effect. It will be a slow start into our winter, but once it is here, our cooler weather will be here to stay.

Black line = temperature this year, blue line = average
If anyone paid attention to my call of 41" of snowfall for Boone, NC, it's actually the same 36" I predicted back in October, except I added the Sandy snowfall event to the winter total. Why? No winter forecast already accounted for a once-in-a lifetime storm that took place in October. 36" of snowfall for the rest of the winter is actually 3" below Boone's average of 39".  You include Sandy's snow accumulation and you get 41" instead, which is right around average for Boone.
Temperature deviations from the norm (Celsius)

Ouch. The first half of this month is looking painful for ski resorts across the Southeast to get much of a base down. Crazy enough is that these most similar winters 1)have a trough moving through around the 12th that is conducive for snow making 2)Greenland blocking starts setting in the last 1/3 of December, helping to drive colder weather farther south.

If someone did account for a storm like Sandy contributing to a heavy snowfall for a winter forecast, please put me in contact with them immediately!

Thursday, November 22, 2012

Most Similar Winters


#1 most similar winter

#2 most similar winter
#3 most similar winter
#4 most similar winter

#5 most similar winter (tied)

#5 most similar winter (tied)

November Winter Forecast Update

Ja


Quick and to the point for people who are interested in just the short version: I am expecting this winter to be 1 below normal temperatures (Appalachian Mountains and west of the Appalachian Mountains), with the remainder of the Southeast being slightly below normal temperatures 2)slightly  above precipitation for the Southeast, with below normal precipitation west of the Appalachian Mountains 3)Above normal snowfall for the Appalachian Mountains, the Mid-Atlantic and the Northeast, near normal snowfall for the Southeast.

***NEW GEOPOTENTIAL HEIGHT ANOMALY PROJECTION***
January 20th - February 15th (projection)


My most similar winters used were : 1951-1952, 1966-1967, 1969-1970, 1977-1978, 1978-1979 and 2008-2009. Note that I treat 1951-1952 and 2008-2009 as nullifying winters; they are included here to drive down the intensity of the other 4 winters. These two are weighted less than the others.

This time, I have added in other primers, such as Siberian snow cover, Arctic ice coverage, strength of the Polar Vortex, and estimations of what I believe the blocking pattern regime will be based on the other 3.
L'Heureux's Weather calculated temperature anomalies from December - February.
The JAMSTEC model (thanks Brad for the link) projection for this winter (temperature anomalies) for December - February. Color scale is from -1.5*C to 1.5*C.
Note that I have subbed out 1952-1953 from the previous forecast, and have added 1969-1970 and 1977-1978. I added 1969-1970 as a warming Pacific scenario, and inserted 1977-1978 to show a westerly oriented weak El Nino strengthening.
L'Heureux's Weather daily precipitation anomalies. Blue = wetter, red = drier.
The JAMSTEC model (again, thank you Brad for the link) projection for this winter (precipitation anomalies) for December - February. Color scale is from -1.5mm/day to 1.5mm/day. Blue = wetter, red = drier.
So in one of these La Nada winters, both the subtropical jet and the polar jet stream have their periods of dominance. The similarities between the Japan model and my output is encouraging that this may be useful for the future.


The Arctic Oscillation is a measure of the strength of the polar vortex; it does this by measuring pressure anomalies in 1)the mid-latitudes 2)the polar regions. For simplicity purposes, I will break down the polar vortex to something we can all relate to: a coffee cup.

Stir a cup of coffee. For this test to work, we need some coffee grinds in our coffee cup. These coffee grinds represent our cold air reservoir. Now, spin your cup in a counter clockwise direction. Notice how when the circulation grows stronger, the grinds/cold air becomes more concentrated under the center. Imagine the coffee itself is a representation of "pressure height anomalies." The center is lower and the edge is higher. This would be an example of a positive phase of the Arctic Oscillation (my red box above). The Arctic has anomalously low surface pressure and the mid-latitudes have anomalously high pressure. Now, put a spoon in your coffee and block the circulation. The circulation will distort and the coffee grinds will spill out from the center. The circulation may even break in half. Now the center is not as low and the edge is not as high. The distorted flow would be something like a negative Arctic Oscillation.

In real life, when the polar vortex is very circular, colder air is bottled up in the Arctic. But when the circulation is less circular, cooler air from the Arctic is pushed into the United States and Europe instead. February 2009, February 2010, and December 2010 were notorious for the flow breaking down entirely and reversing in the Arctic stratosphere, because the stratosphere over the Arctic was warmer than the stratosphere in the mid-latitudes.
The changes of the storm track and pressure patterns between the positive phase of the NAO and the negative phase of the NAO.
The North Atlantic Oscillation is a branch of the Arctic Oscillation but is important enough on its own to mention. A positive phase has a stronger than normal low pressure near Iceland and a stronger than normal high pressure over the Azores. A negative phase has weaker pressures over both.

The PNA is a little trickier but think of it as an equivalent to what the NAO does for the east coast, over the west coast instead. In a positive phase, there is a ridge over the northwest, a trough south of Alaska, and a trough over the Southeast. This is another helping hand in distorting the Polar Vortex. There is a theory that the PNA is a bridge between ENSO and the Arctic. The literature is still a little muddled and I will not include much here, except that in an El Nino winter the PNA tends to lean positive.
Impacts of the NAO and PNA on the storm track


We have two primary cold spells: the first is from December 24th - January 4th and the second is from February 10th - February 21st. We have three secondary cool spells from December 10th - December 18th, January 20th - January 25th, and January 27th - February 10th.

We have a primary warm spell March 15th onward, and two secondary warm spots: January 6th - January 15th and March 6th - March 15th.

Anything not in red or blue is "neutral".

So again, quick and to the point, I am expecting this winter to be 1)slightly below normal temperatures (Appalachian Mountains and west of the Appalachian Mountains), with the remainder of the Southeast being at near normal temperatures 2)slightly below normal precipitation for the Southeast, with above normal precipitation west of the Appalachian Mountains 3)Above normal snowfall for the Ohio River Valley and the Northeast, near normal snowfall for the Southeast. Northwest Flow will play a larger role for the Appalachian Mountains this winter while the rest of the Southeast may have its snow opportunity in 1)Late December 2)February. The battle zone certainly seems to be in the Mid-Atlantic and the Northeast this year.

The Pacific Northwest stays chilly but near neutral for the winter. The northern plains I expect to have drier conditions for the winter, while the Rockies get a time share deal from a boosted subtropical jet and a polar jet, both of which are competing for the #1 slot. I would wait for those + AO periods for precipitation for the northern Rockies and a -AO period for precipitation in the southern Rockies.
500mb Height Anomalies December - February
The Deep South will be robbed of moisture until those -AO periods due to the battle zone being farther north (Midwest, Ohio River Valley). My concern for these areas and with the Southeast comes from increased ice storm chances late December (primary risk Midwest, secondary Mid-Atlantic) and February (primary risk Mid-Atlantic, secondary risk Midwest).


 And for more clarity how snow cover over Siberia plays a role....
Image 1 = November jet stream,  brown = October 15th snow cover
Image 2 = November jet stream,  November Geopotential Height Anomalies

Note that the years with the greater onset of Siberian snow cover have stronger warm anomalies pushing into the Arctic (2009, 2010, 2012). The strongest points in the Jet Stream correspond to the greatest north/south pressure gradient.


Thursday, October 25, 2012

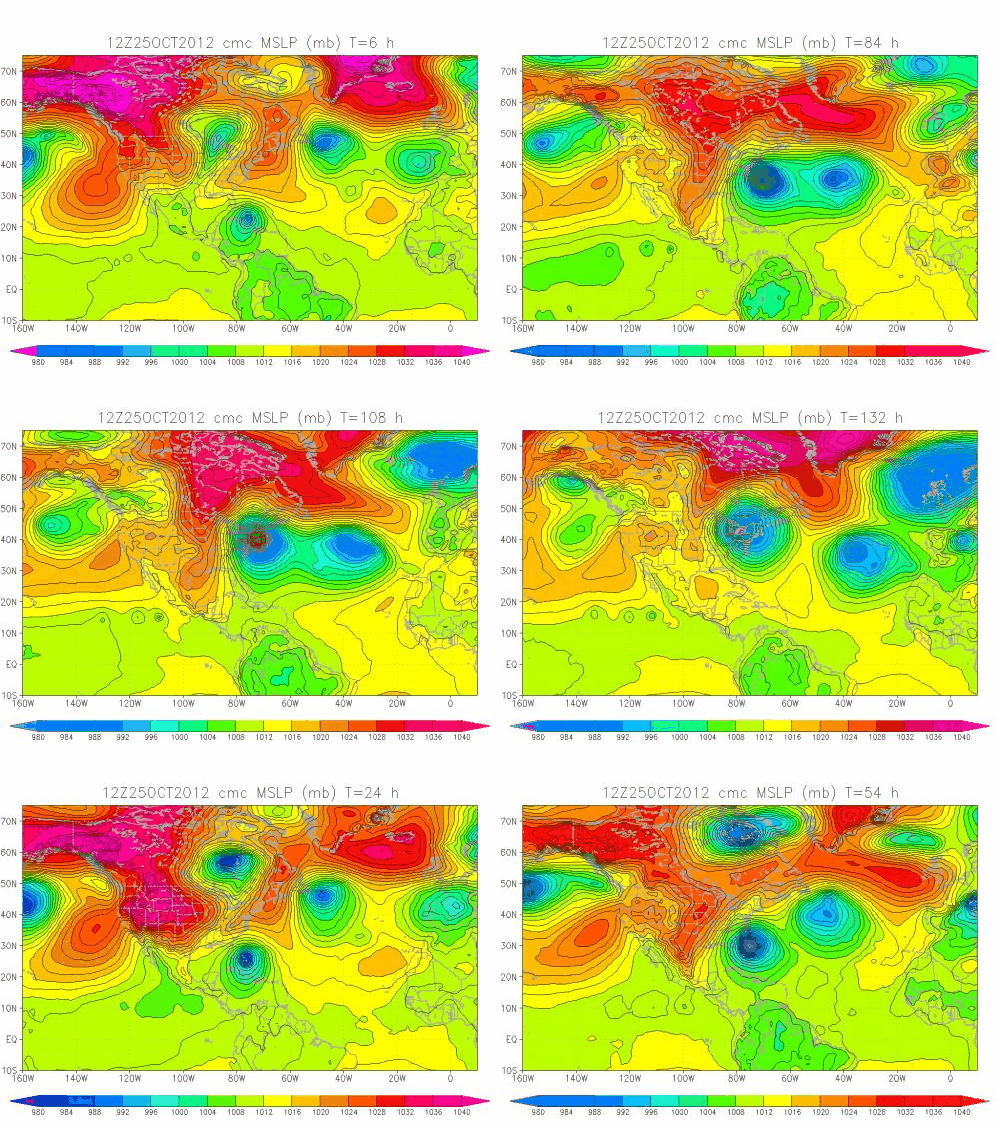
Cluster-Cuss Storm Sandy


I'll have to ask Baker Perry if there has been a Northwest Flow Snowfall event induced by a subtropical or Extra-Tropical Storm...amounts shown are grossly over-exaggerated though.
Precipitation projections over the next several days

Surface winds at landfall of what will be Extra-Tropical storm Sandy


This is to show the really awesome blocking patterns in the stratosphere that are inducing this.

First the precipitation type model through 168 hours out. Notice that with the more southerly tracking Sandy, more snow seems to appear around the High Country. Also note the significance of the snow for West Virginia.
My vorticity run. Sometimes two lovers were just meant to be...


The FSU model run (surface pressure).