Thursday, November 22, 2012

Most Similar Winters


#1 most similar winter

#2 most similar winter
#3 most similar winter
#4 most similar winter

#5 most similar winter (tied)

#5 most similar winter (tied)

November Winter Forecast Update

Ja


Quick and to the point for people who are interested in just the short version: I am expecting this winter to be 1 below normal temperatures (Appalachian Mountains and west of the Appalachian Mountains), with the remainder of the Southeast being slightly below normal temperatures 2)slightly  above precipitation for the Southeast, with below normal precipitation west of the Appalachian Mountains 3)Above normal snowfall for the Appalachian Mountains, the Mid-Atlantic and the Northeast, near normal snowfall for the Southeast.

***NEW GEOPOTENTIAL HEIGHT ANOMALY PROJECTION***
January 20th - February 15th (projection)


My most similar winters used were : 1951-1952, 1966-1967, 1969-1970, 1977-1978, 1978-1979 and 2008-2009. Note that I treat 1951-1952 and 2008-2009 as nullifying winters; they are included here to drive down the intensity of the other 4 winters. These two are weighted less than the others.

This time, I have added in other primers, such as Siberian snow cover, Arctic ice coverage, strength of the Polar Vortex, and estimations of what I believe the blocking pattern regime will be based on the other 3.
L'Heureux's Weather calculated temperature anomalies from December - February.
The JAMSTEC model (thanks Brad for the link) projection for this winter (temperature anomalies) for December - February. Color scale is from -1.5*C to 1.5*C.
Note that I have subbed out 1952-1953 from the previous forecast, and have added 1969-1970 and 1977-1978. I added 1969-1970 as a warming Pacific scenario, and inserted 1977-1978 to show a westerly oriented weak El Nino strengthening.
L'Heureux's Weather daily precipitation anomalies. Blue = wetter, red = drier.
The JAMSTEC model (again, thank you Brad for the link) projection for this winter (precipitation anomalies) for December - February. Color scale is from -1.5mm/day to 1.5mm/day. Blue = wetter, red = drier.
So in one of these La Nada winters, both the subtropical jet and the polar jet stream have their periods of dominance. The similarities between the Japan model and my output is encouraging that this may be useful for the future.


The Arctic Oscillation is a measure of the strength of the polar vortex; it does this by measuring pressure anomalies in 1)the mid-latitudes 2)the polar regions. For simplicity purposes, I will break down the polar vortex to something we can all relate to: a coffee cup.

Stir a cup of coffee. For this test to work, we need some coffee grinds in our coffee cup. These coffee grinds represent our cold air reservoir. Now, spin your cup in a counter clockwise direction. Notice how when the circulation grows stronger, the grinds/cold air becomes more concentrated under the center. Imagine the coffee itself is a representation of "pressure height anomalies." The center is lower and the edge is higher. This would be an example of a positive phase of the Arctic Oscillation (my red box above). The Arctic has anomalously low surface pressure and the mid-latitudes have anomalously high pressure. Now, put a spoon in your coffee and block the circulation. The circulation will distort and the coffee grinds will spill out from the center. The circulation may even break in half. Now the center is not as low and the edge is not as high. The distorted flow would be something like a negative Arctic Oscillation.

In real life, when the polar vortex is very circular, colder air is bottled up in the Arctic. But when the circulation is less circular, cooler air from the Arctic is pushed into the United States and Europe instead. February 2009, February 2010, and December 2010 were notorious for the flow breaking down entirely and reversing in the Arctic stratosphere, because the stratosphere over the Arctic was warmer than the stratosphere in the mid-latitudes.
The changes of the storm track and pressure patterns between the positive phase of the NAO and the negative phase of the NAO.
The North Atlantic Oscillation is a branch of the Arctic Oscillation but is important enough on its own to mention. A positive phase has a stronger than normal low pressure near Iceland and a stronger than normal high pressure over the Azores. A negative phase has weaker pressures over both.

The PNA is a little trickier but think of it as an equivalent to what the NAO does for the east coast, over the west coast instead. In a positive phase, there is a ridge over the northwest, a trough south of Alaska, and a trough over the Southeast. This is another helping hand in distorting the Polar Vortex. There is a theory that the PNA is a bridge between ENSO and the Arctic. The literature is still a little muddled and I will not include much here, except that in an El Nino winter the PNA tends to lean positive.
Impacts of the NAO and PNA on the storm track


We have two primary cold spells: the first is from December 24th - January 4th and the second is from February 10th - February 21st. We have three secondary cool spells from December 10th - December 18th, January 20th - January 25th, and January 27th - February 10th.

We have a primary warm spell March 15th onward, and two secondary warm spots: January 6th - January 15th and March 6th - March 15th.

Anything not in red or blue is "neutral".

So again, quick and to the point, I am expecting this winter to be 1)slightly below normal temperatures (Appalachian Mountains and west of the Appalachian Mountains), with the remainder of the Southeast being at near normal temperatures 2)slightly below normal precipitation for the Southeast, with above normal precipitation west of the Appalachian Mountains 3)Above normal snowfall for the Ohio River Valley and the Northeast, near normal snowfall for the Southeast. Northwest Flow will play a larger role for the Appalachian Mountains this winter while the rest of the Southeast may have its snow opportunity in 1)Late December 2)February. The battle zone certainly seems to be in the Mid-Atlantic and the Northeast this year.

The Pacific Northwest stays chilly but near neutral for the winter. The northern plains I expect to have drier conditions for the winter, while the Rockies get a time share deal from a boosted subtropical jet and a polar jet, both of which are competing for the #1 slot. I would wait for those + AO periods for precipitation for the northern Rockies and a -AO period for precipitation in the southern Rockies.
500mb Height Anomalies December - February
The Deep South will be robbed of moisture until those -AO periods due to the battle zone being farther north (Midwest, Ohio River Valley). My concern for these areas and with the Southeast comes from increased ice storm chances late December (primary risk Midwest, secondary Mid-Atlantic) and February (primary risk Mid-Atlantic, secondary risk Midwest).


 And for more clarity how snow cover over Siberia plays a role....
Image 1 = November jet stream,  brown = October 15th snow cover
Image 2 = November jet stream,  November Geopotential Height Anomalies

Note that the years with the greater onset of Siberian snow cover have stronger warm anomalies pushing into the Arctic (2009, 2010, 2012). The strongest points in the Jet Stream correspond to the greatest north/south pressure gradient.


Thursday, October 25, 2012

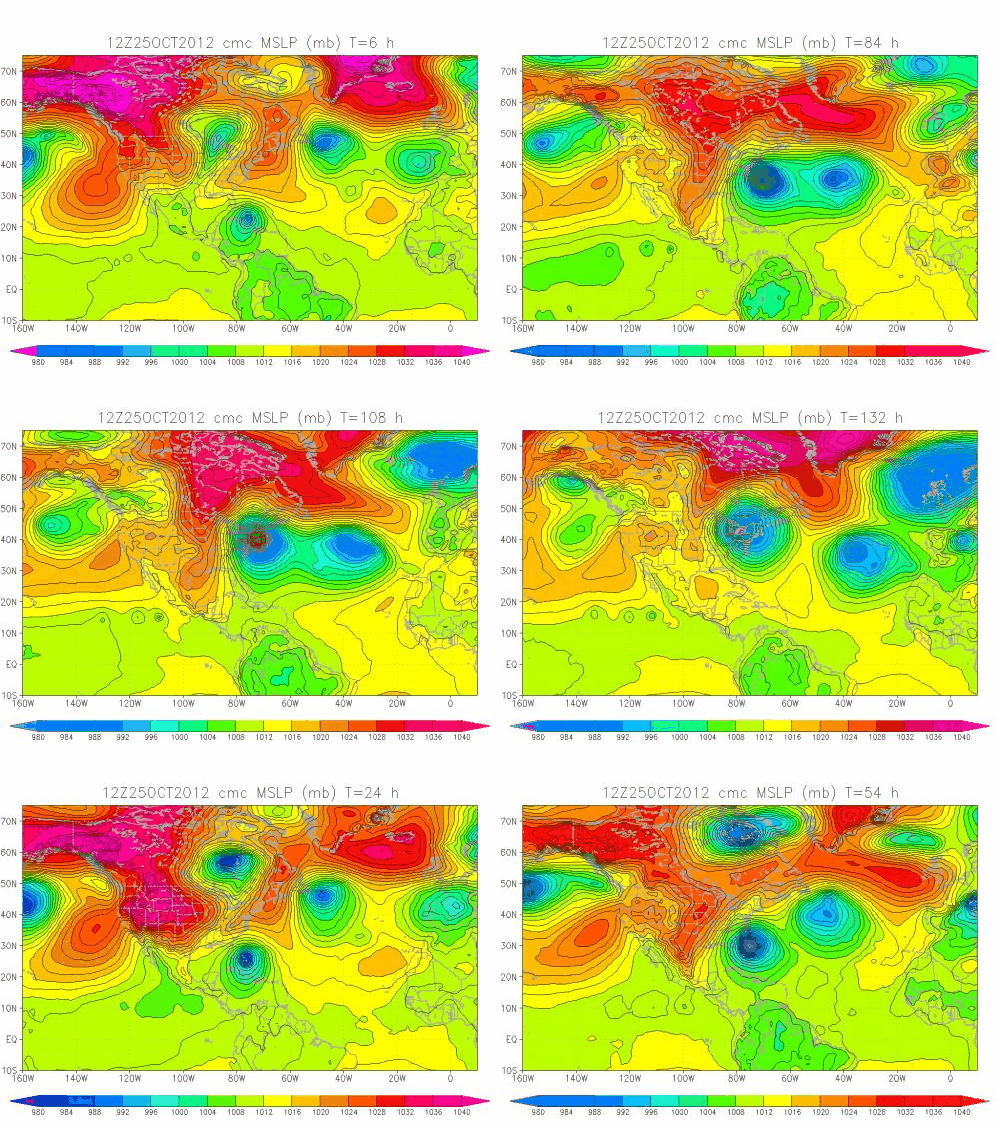
Cluster-Cuss Storm Sandy


I'll have to ask Baker Perry if there has been a Northwest Flow Snowfall event induced by a subtropical or Extra-Tropical Storm...amounts shown are grossly over-exaggerated though.
Precipitation projections over the next several days

Surface winds at landfall of what will be Extra-Tropical storm Sandy


This is to show the really awesome blocking patterns in the stratosphere that are inducing this.

First the precipitation type model through 168 hours out. Notice that with the more southerly tracking Sandy, more snow seems to appear around the High Country. Also note the significance of the snow for West Virginia.
My vorticity run. Sometimes two lovers were just meant to be...


The FSU model run (surface pressure).


Thursday, October 18, 2012

October Winter Forecast Update

Decaying El Nino pattern with time. We're going into our La Nada winter.


Quick and to the point for people who are interested in just the short version: I am expecting this winter to be 1)slightly below normal temperatures (Appalachian Mountains and west of the Appalachian Mountains), with the remainder of the Southeast being at near normal temperatures 2)slightly below normal precipitation for the Southeast, with above normal precipitation west of the Appalachian Mountains 3)Above normal snowfall for the Ohio River Valley and the Northeast, near normal snowfall for the Southeast.


Hang on, doesn't that conflict with just about everyone else forecast thus far? Yes. However, this is a tricky scenario unfolding for this winter and everyone has their own interpretation of what is going to happen over the next several months. With that being said, lets jump into the heart of the forecasting!

My top 5 most similar winters used were : 1951-1952, 1952-1953, 1966-1967, 1978-1978, and 2008-2009.

The JAMSTEC model (thanks Brad for the link) projection for this winter (temperature anomalies) for December - February. Color scale is from -1.5*C to 1.5*C.

L'Heureux's Weather temperature anomalies (Dec - February) using the top 5 winters method.

The conflict between my output and the models output is with northern Alaska and northwest Canada. For those regions, my output shows this as anomalously cold while the model output shows it as "warm." But this is the only conflict I have run into (and my output is only 1*C off from the model output).

October model projections for precipitation anomalies for this winter. Blue = positive anomalies, red = negative.
L'Heureux's Weather precipitation anomalies. Red = drier, blue = wetter.

I actually did a double take when this popped up. But the more I thought about it, the more sense it made. We have a retreating summertime El Nino pattern and will be entering into a "La Nada" winter (neither warm or cold water anomalies). An index heavily used in my forecast, the Multivariate ENSO Index (MEI) uses more factors than just sea surface temperature anomalies alone.  From the MEI site "These six variables are: sea-level pressure (P), zonal (U) and meridional (V) components of the surface wind, sea surface temperature (S), surface air temperature (A), and total cloudiness fraction of the sky (C)". This in my opinion makes it a more accurate estimation of true ENSO conditions rather than just the water temperatures alone. But for the sake of consistency with other forecast methods, I have factored the water temperature anomalies too.

So in one of these La Nada winters, both the subtropical jet and the polar jet stream have their periods of dominance. You will see that very clearly in the storm track animation below. Lets dive into our drivers first.


Northern Annular Mode (the Arctic Oscillation) impacts on the weather patterns.
The Arctic Oscillation is a measure of the strength of the polar vortex; it does this by measuring pressure anomalies in 1)the mid-latitudes 2)the polar regions. For simplicity purposes, I will break down the polar vortex to something we can all relate to: a coffee cup.

Stir a cup of coffee. For this test to work, we need some coffee grinds in our coffee cup. These coffee grinds represent our cold air reservoir. Now, spin your cup in a counter clockwise direction. Notice how when the circulation grows stronger, the grinds/cold air becomes more concentrated under the center. Imagine the coffee itself is a representation of "pressure height anomalies." The center is lower and the edge is higher. This would be an example of a positive phase of the Arctic Oscillation (my red box above). The Arctic has anomalously low surface pressure and the mid-latitudes have anomalously high pressure. Now, put a spoon in your coffee and block the circulation. The circulation will distort and the coffee grinds will spill out from the center. The circulation may even break in half. Now the center is not as low and the edge is not as high. The distorted flow would be something like a negative Arctic Oscillation.

In real life, when the polar vortex is very circular and zonal (west to east), colder air is bottled up in the Arctic. But when warmer air from the mid-latitudes is driven into the Arctic (as a ridge), it can distort the circulation. If it distorts enough, cooler air from the Arctic is pushed into the mid-latitude regions instead. A zonal flow needs cooler air to the north and warmer air to the south to create its west to east flow (thermal wind). The stronger the contrast, the stronger the west to east flow. But if one were to weaken that contrast, the zonal wind flow weakens with it. February 2009, February 2010, and December 2010 were notorious for the flow breaking down entirely and reversing in the Arctic stratosphere, because the stratosphere over the Arctic was warmer than the stratosphere in the mid-latitudes.
The changes of the storm track and pressure patterns between the positive phase of the NAO and the negative phase of the NAO.
The North Atlantic Oscillation is a branch of the Arctic Oscillation but is important enough on its own to mention. A positive phase has a stronger than normal low pressure near Iceland and a stronger than normal high pressure over the Azores. A negative phase has weaker pressures over both.

The PNA is a little trickier but think of it as an equivalent to what the NAO does for the east coast, over the west coast instead. In a positive phase, there is a ridge over the northwest, a trough south of Alaska, and a trough over the Southeast. This is another helping hand in distorting the Polar Vortex. There is a theory that the PNA is a bridge between ENSO and the Arctic. The literature is still a little muddled and I will not include much here, except that in an El Nino winter the PNA tends to lean positive.
Impacts of the NAO and PNA on the storm track
Watch the wind animation below. Notice that when the height anomalies reverse over the Atlantic, the wind arrows become shorter as well (late December and again in late January/February) Also notice that when the Arctic Oscillation is in a negative phase (lots of red over the Arctic) the storm track goes a lot farther south too, and the zonal flow into the northern United States is weaker. This is good for snowfall across the east coast.


The flagship animation. The 500mb geopotential height anomalies with the storm track on a daily time scale (top 5 winters). The plots are smoothed out via use of a 5-day running mean.
The projections for the Arctic Oscillation this winter; the blue bars represent the top 5 most similar winters and the red bars represent the top 10 most similar winters (bottom North Atlantic Oscillation). The boxes around the graphs represent clear warm phases and cold phases. Lighter colors are equal to the minor warm/cold phases.
500mb wind speed, December 1st - March 31st

My wind animation (above), using the 5-day running mean for the top 5 winters selected.
500mb geopotential height anomalies, December 1st - March 31st

So again, quick and to the point, I am expecting this winter to be 1)slightly below normal temperatures (Appalachian Mountains and west of the Appalachian Mountains), with the remainder of the Southeast being at near normal temperatures 2)slightly below normal precipitation for the Southeast, with above normal precipitation west of the Appalachian Mountains 3)Above normal snowfall for the Ohio River Valley and the Northeast, near normal snowfall for the Southeast. Northwest Flow will play a larger role for the Appalachian Mountains this winter while the rest of the Southeast may have its snow opportunity in 1)Late December 2)February. The battle zone certainly seems to be in the Ohio River Valley and the northern Mid-Atlantic this year.

The Pacific Northwest stays chilly but slightly dry for the winter. The northern plains I expect to have drier conditions for the winter, while the Rockies get a time share deal from a boosted subtropical jet and a polar jet, both of which are competing for the #1 slot. I would wait for those + AO periods for precipitation for the northern Rockies and a -AO period for precipitation in the southern Rockies.

The Deep South will be robbed of moisture until those -AO periods due to the battle zone being farther north (Midwest, Ohio River Valley). My concern for these areas and with the Southeast comes from increased ice storm chances late December (primary risk Midwest, secondary Mid-Atlantic) and February (primary risk Mid-Atlantic, secondary risk Midwest). There was not much amplitude with the trough in respect to the wavelength itself, and weak low pressure systems over the Midwest with a cold air component OR a two-tier low (primary weakens west of Appalachian Mountains, secondary forms along east coast) to them are a good indicator for mixed precipitation.


Thursday, September 13, 2012

September Update: 2012-2013 Winter Forecast

December 500mb geopotential height anomalies for most similar winters

January 500mb geopotential height anomalies for most similar winters


February 500mb geopotential height anomalies for most similar winters

March 500mb geopotential height anomalies for most similar winters
Needless to say, it seems that we will have a slow start to our winter, followed by a very backloaded (snowy and cold) for February and March. For the top 5 ranked winters that are most similar to this upcoming one based on longer term teleconnection indices, all 5 had the majority of their snowfall in February and March.


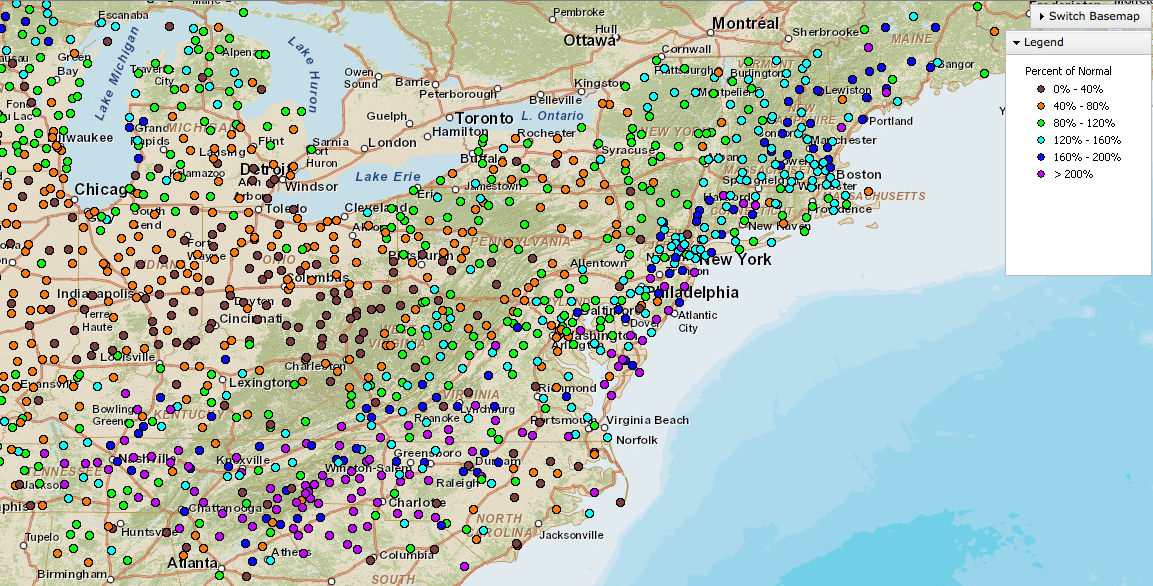
#1 ranked winter snowfall: percentage of mean snowfall (year = 1969)

#2 ranked winter snowfall: percentage of mean snowfall (year = 1964)

#3 ranked winter snowfall: percentage of mean snowfall (year = 1952)

#4 ranked winter snowfall: percentage of mean snowfall (year = 1991)

#5 ranked winter snowfall: percentage of mean snowfall (year = 1995)

Tuesday, September 4, 2012

Is Hurricane Isaac a Prophecy?

Normally I don't dive into spirituality let alone try to use it to explain why certain meteorological phenomena happen. However, Hurricane Isaac has become a hot button topic due to its name and its path.

This is why I want to devote this blog post to the similarities that Isaac has with a certain "mystical" figure. This figure had an entire empire devoted to his cause, his strength, and his might. Entire legions feared the might and the power of Isaac. And the life cycle of Isaac is remarkably similar to this mystical figure.

This mystical figure......is Frieza.


Hurricane Isaac ruled the Caribbean and the Gulf of Mexico on its own, suppressing its true strength until just before landfall. Isaac had one of the lowest central pressures for a tropical storm that had not yet reached hurricane strength, at 976mb. Due to dry air entrainment into its central core, Isaac used its energy to expand its wind field and lower the pressure gradient between its center and the outside environment. A ragged eye kept forming and then collapsing due to the dry air entrainment. Tropical storms are warm core systems; the strongest winds are found at the lower/mid levels of the system instead of the upper level. Tropical cyclones derive their energy from the latent heat release from condensing water vapor. Water vapor condensing releases heat into the core, and this warmth exchange keeps the center of circulation buoyant to allow for more vertical growth. Since the bulk of latent heat release is in the lower/mid levels, the greatest temperature contrast between the core and the environment is at the lower/mid levels. Dry air encourages evaporation, and anyone who has gotten out of a shower before without a towel rapidly gets cold from heat being removed. Dry air cools the warm core nature of the system, and hence why it inhibited the wind field from contracting within Isaac.

Frieza had so much power that He himself could not control it, and thus transformed into a weaker state because He himself feared being unable to control his own power. This is one similarity that Isaac has with Frieza. Both kept their maximum power suppressed until just before the end.


Above: Isaac and Frieza in their weaker forms: the birth of two tyrants.

We saw many forms of Isaac, from a weakened tropical storm over Hispanola to a mid level category one hurricane at landfall. Frieza himself had many forms over his lifetime, each of which became more fearsome.

At the time of reckoning, Isaac made landfall on the southeast coast of Louisiana and drifted back out into the Gulf of Mexico before stalling just off shore for 12 hours. Goku himself had just five minutes to fight the Tyrant and put an end to his galactic conquest but this would take 20 episodes to complete.  And thus, Isaac maintained its peak intensity for much longer than those thought, due to its central core *finally* contracting. A contracting eyewall conserves its angular momentum when encountering rough surface friction (from land). Thus, Isaac was able to maintain its peak intensity despite land interaction. Isaac would bring a surge of power in the form of storm surge, despite appearing to only be a category one storm.
Frieza himself landed on a dry planet that would make it difficult to support life, just as Isaac had to contend with dry air penetrating its core. This planet was the planet Namek and He would search for eternal life with the Dragonballs


Isaac would put up a valiant fight with the land interaction, with an excellent outflow and plentiful moisture now pumping into its core. But Isaac alas, was being steered by a calm nature system, known as an upper level ridge. This ridge (Goku) would slowly but surely deprive Isaac (Frieza) of its power and might.


And it did. As Isaac moved farther away from the Gulf of Mexico, its source of power dwindled, and Isaac was downgraded to a tropical depression soon after.


The ridge (Midwest) that provided the steering currents for Isaac
 Even after losing most of its power, Isaac was still a threat and promoted heavy flooding inland Louisiana and Arkansas. Fortunately, the Mississippi River was at a low level when the rain fell, or otherwise the flooding would have been far worse along the river.

The circulation of Isaac was ripped in half by an upper level trough. Half of the circulation was carried along with the parent trough while the lower half would be removed entirely from the trough and left behind. This would be the last we heard from Isaac.

The Dragonballs were used to send everyone but Goku and Frieza back to Earth, leaving the two stranded on a dying planet to battle it out! Frieza for a time contended against Goku but He would falter and weaken. Goku decided to call off the fight, but Frieza would not. Unfortunately for Frieza, he would be sliced in half and left to die.


 Isaac was no more. Frieza was no more. But left behind were memories of the suffering and destruction each left behind.

But alas, this would not be the end of either.
The split! Southern circulation of Isaac (over Alabama) and northern circulation (over Ohio)
The split! Frieza is sliced in half!

Frieza would be discovered nearly dead floating in space, when He was picked up by none other than King COLD himself. He would be put into a rejuvenation chamber and rebuilt. He would become faster and stronger than he was before. Incidentally, Goku's warm hearted nature in sparing Frieza's life would come back to haunt him.

Isaac was left to dissipate over Missouri/Illinois/Indiana, having merged with an upper level trough. It would seem that its identity would be lost forever. However a COLD core cutoff low approaching Florida would help steer the remaining circulation back towards the Gulf of Mexico. Incidentally, the lack of shear within the upper level ridge steering Isaac inland would be what kept the lower/mid circulation intact.

The COLD core low, what helped the remnant southern half of Isaac to move back towards the Gulf of Mexico


King COLD, who saved the remains of Frieza and saved His life.

Frieza would be made faster and stronger than before. Isaac is now moving back out over the Gulf of Mexico. Whether it will be renamed Isaac or named a new system entirely is the question, but one thing remains. A piece of Isaac is alive. And there are projections that it may reform back into a depression status.

However this depression is projected to not last very long and be ripped to pieces, never to be brought back again (except to send heavy rain back over Florida.

The southern fragment of Isaac, moving back out over the Gulf of Mexico.
Isaac two day projection (closed low over the Gulf)

And by day 5, Isaac is cut to pieces by a strong approaching trough, making its resurrection short lived.
And Frieza is cut to pieces, by a super saiyan named Trunks, making His resurrection short lived.