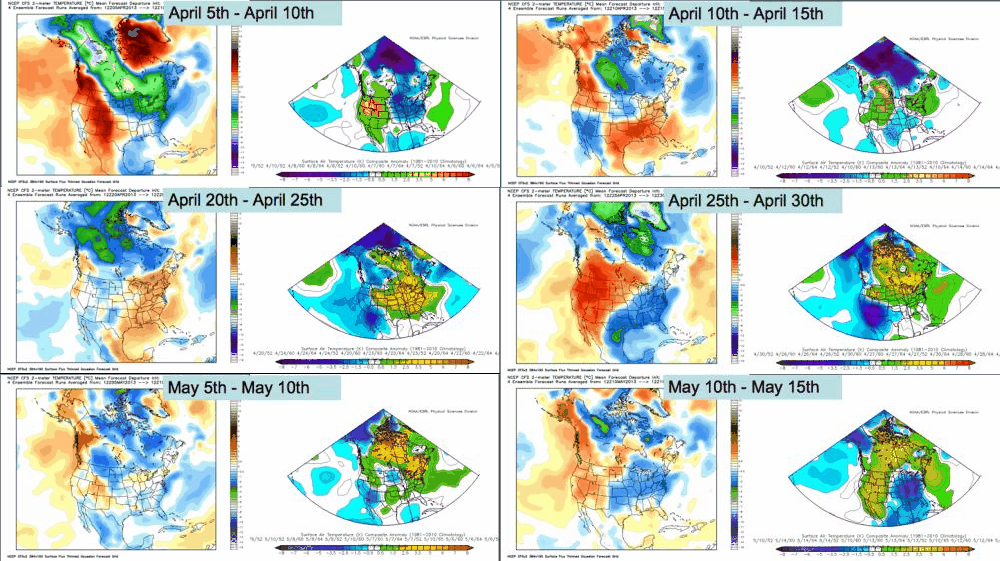
First
things first - the April 1st - May 31st forecast for geopotential
heights. Blue would suggest a cooler than usual atmosphere (from a lower
500mb level) and a red color would suggest a warmer than usual
atmosphere (from a higher 500mb level). I ran a weighted average of my
most similar years from my original November winter forecast (1952, 1960, and 1964) up through May 30th. Note, this is a 5-day running mean.
 |
| Sorry I don't have the large date title at the top - the mini dates above the color bar may help. Note the cool start to April followed by the persistent warmth from April 8th through May 1st. |
This output is the CFS sub-monthly output (0-45 days out) coupled with the 3 most similar spring setups.

