Wednesday, January 30, 2013

2013-01-30 Forecast Update


***Please note the time stamp is incorrect. The time shown on the animations should have +1 hours added on (for example, 2PM is really 3PM).***

Radar composite reflectivity forcast


Estimated rainfall (inches per hour)

Expected wind gusts (in knots)


Maximum wind speed


Visibility. A gray area is more likely to be fog, especially along the eastern slopes of the mountains
Updraft helicity. Helicity is the growth of horizontally oriented spin (a corkscrew motion). Upward helicity is the corkscrew spin growth in the vertical. Areas that are pinged are more likely to have squall line induced vortices that have a damaging wind component.

Monday, January 21, 2013

2013/01/23 Snow Forecast (Originally 1/20 forecast)


NAM Model Run 18Z

 
ECMWF snow projections, with the freezing line


Historically most similar storms with snow accumulations


Here we go with another snow producing system for this Friday. Note that with the presence of a weak warm layer aloft, there is a slight chance of sleet mixing in. The warm layer doesn't seem to be strong enough for freezing rain (complete melting), and we will not have the warm ground issue like our last system. Instead, what falls will likely stick right away. I expect this week to remain cold however there will be a short mild trend for next week. Late next week we get a harsh burst of cold air. For good measure, check this out: the plot was used from data I calculated back in November!


Thursday, January 17, 2013

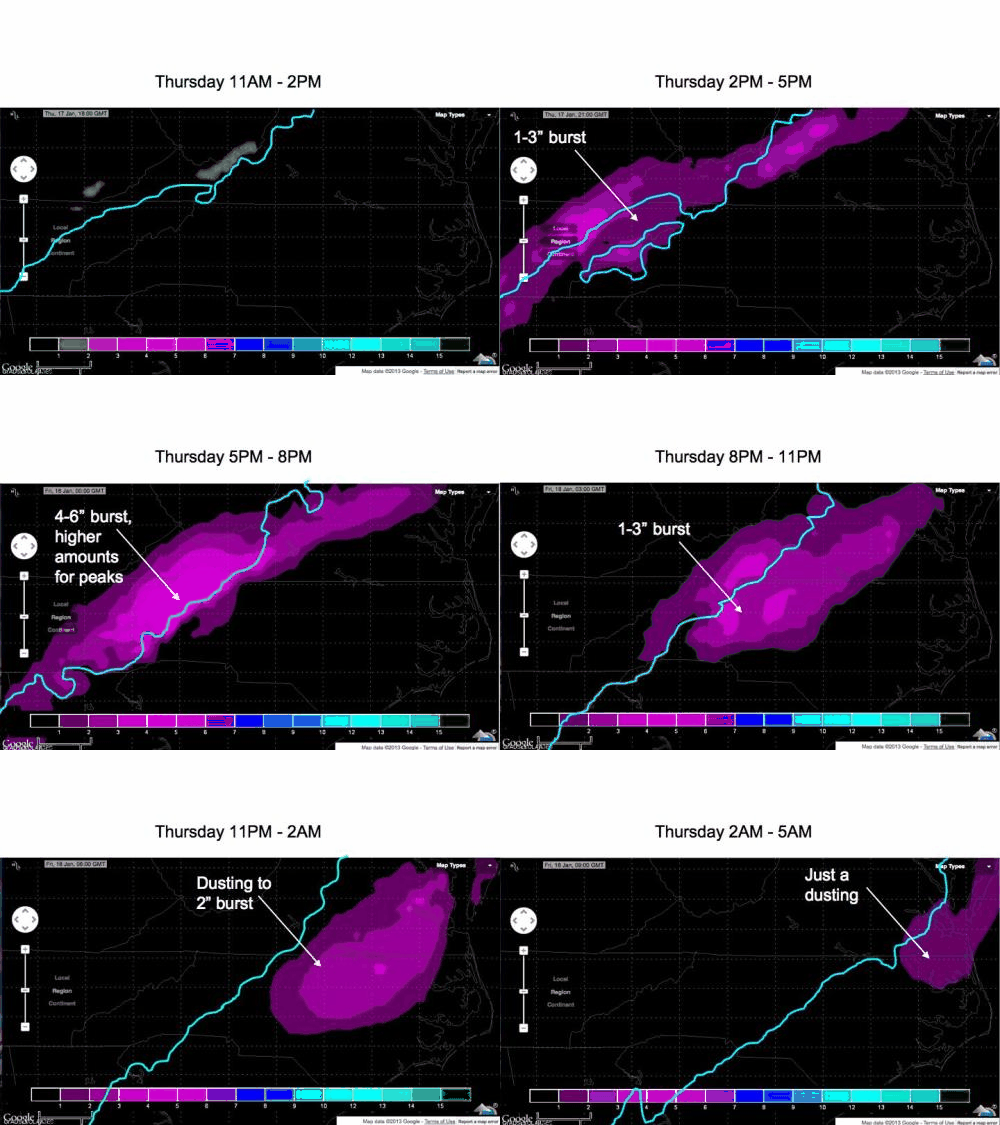
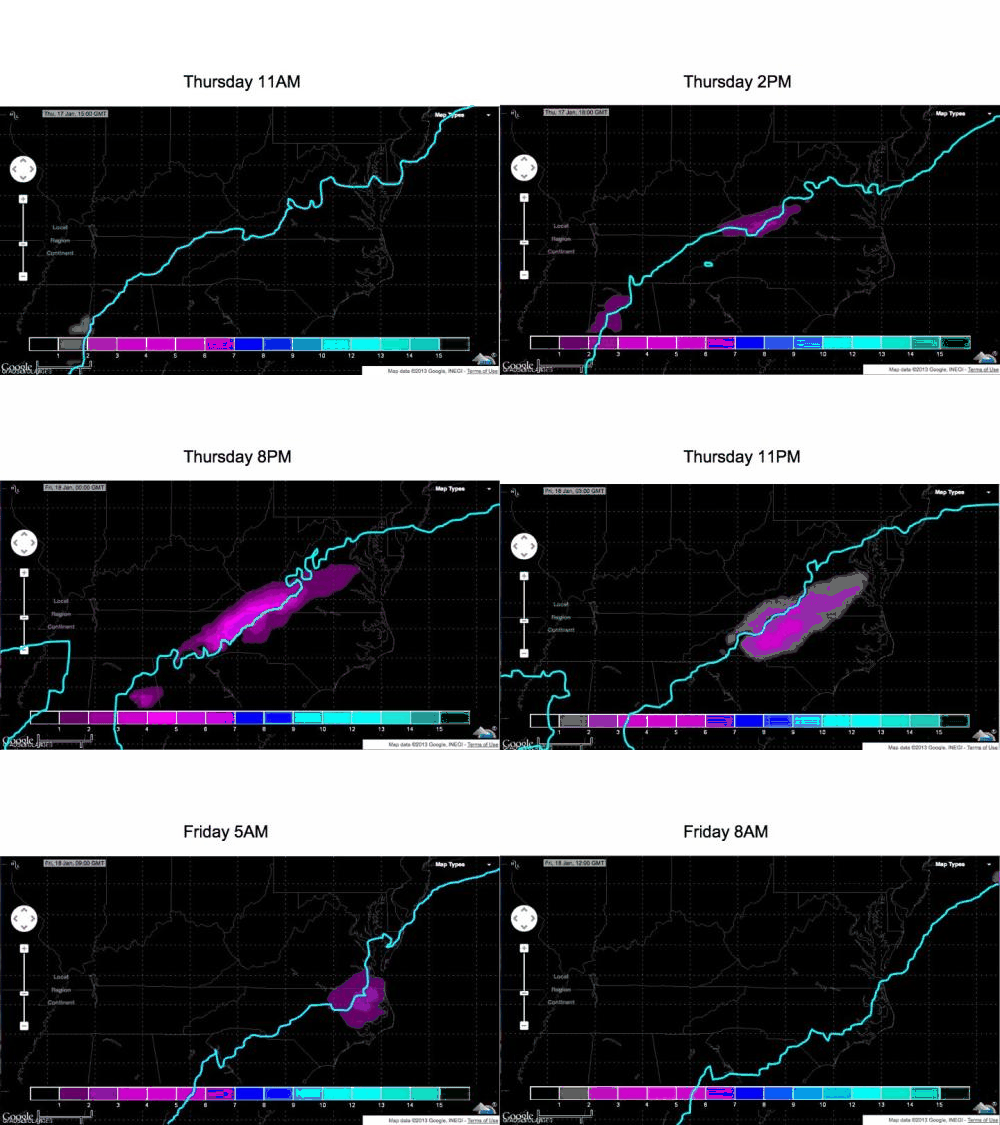
2013/01/17 Snow Update

WRF Model snow water equivalent (SWE)


Total snow accumulation for Thursday afternoon - Friday morning
A model agrees with me! So I'm not alone!


Wednesday, January 16, 2013

2013/01/16 Snow Projections


What changed from yesterday? Yesterday, the upper level component from within the southern branch of the jet stream was being stretched out into oblivion by a much larger trough from the northern branch of the jet stream. Today, the system is maintaining integrity through the Carolinas. You can see the difference between yesterday and today below. Note in the newer animation I have kept the "freezing line" at the surface. Note the newer track has the upper level component traveling farther south, thus delaying the onset of the weakening of the southern trough carrying this disturbance.

Yesterday's 500mb winds

Today's 500mb winds (with freezing line at the surface)

The ECMWF snow projections, with the freezing line in blue. Note that it is picking up snowfall south of the freezing line - which is accurate for the near freezing temperatures located there. South of the line, I would take 50% of the snowfall that is showing up in the model run. For other locations, the first image there is snowfall, take off 1-1.5" from the total, to account for the warm ground that must be cooled first.

ECMWF Model Snow Output


Tuesday, January 15, 2013

Forecast 2013/01/15

500mb level winds. You can see the degeneration of the upper level trough through the animation. Note that it gets flatter and flatter with time.

Precipitation, with the rain/snow line in light blue. Note the orange polygon - this is where I expect a mix of wet snow and rainfall, leading to a slushy accumulation on grassy surfaces.
Snow accumulations for the Appalachian Mountains will be less than 1" - this system is moving too quickly and is weakening too rapidly to amount to much else. With a probable 8:1 snow ratio for the mountains, 7:1 for the foothills, and with the orange area, 6:1. Snow accumulations will be at maximum, 1-2"(southern Appalachian Mountains). I-85 northward will get a dusting to 1"

Monday, January 14, 2013

Archived Winter Forecast, 2013/01/14


Enjoy the 30 day sample forecast (experimental)! Although this source is free to use, please use proper citation if this data is being redistributed.
The 500-mb height anomaly. Blue = cold, red = warm. If you are south of the snowflake, rainfall is the most probable precipitation type. If you are inside the snowflake, good news, this is your rain/snow line. If you are just north of the snowflake, better news for snowfall.
  = Probable location of snowfall
= Likely warm anomaly

Want to be able to forecast the weather or know what it is doing far in advance? Welcome to the archive winter forecast, or better known as the "Most similar winters" forecast technique. This approach uses the most similar winters in the past to forecast what will happen with this current winter. I look for winters that had a similar pattern leading into the winter and a similar pattern in the winter before I put them together. The index was originally put together October 29th, 2012, with a modification on November 15th. Since then, what you see is unchanged since November 15th.

So what is this animation showing? It shows how high up you must fly to find an air pressure equivalent of 500 millibars. A blue spot means that height level is lower than it should be, suggesting cold air underneath. A red spot suggests the height level is higher than it should be, suggesting warm air underneath. The snowflakes highlight probable locations for snowfall while the blowtorch is an area that has temperatures way above average.

Please note that because this is historical data, not directly modeled forecast data, the sample animation is likely to be off 1-3 days in some parts. Additional error may arise from a "+" anomaly one year canceling out a "-" anomaly that appeared the next year.  This tool is recommended to be used to assist in forecasting, not to be a sole source for forecasting.

You can read the "Version 1" winter forecast here
http://lheureuxsweather.blogspot.com/2012/10/october-winter-forecast-update.html
And the "Version 2" here
http://lheureuxsweather.blogspot.com/2012/11/november-winter-forecast-update.html
To see what changes I have made (and the line of thought I had). Snow maps for the most similar archived winters can be found here.
http://lheureuxsweather.blogspot.com/2012/11/most-similar-winters.html