Tuesday, April 2, 2013

April - May Spring Forecast


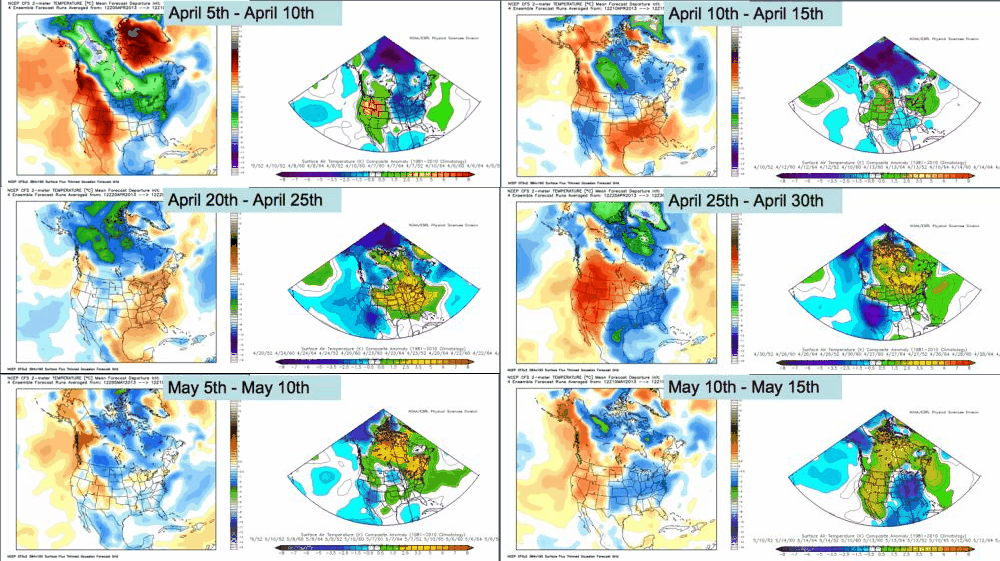
 First things first - the April 1st - May 31st forecast for geopotential heights. Blue would suggest a cooler than usual atmosphere (from a lower 500mb level) and a red color would suggest a warmer than usual atmosphere (from a higher 500mb level). I ran a weighted average of my most similar years from my original November winter forecast (1952, 1960, and 1964) up through May 30th. Note, this is a 5-day running mean.


Sorry I don't have the large date title at the top - the mini dates above the color bar may help. Note the cool start to April followed by the persistent warmth from April 8th through May 1st.


This output is the CFS sub-monthly output (0-45 days out) coupled with the 3 most similar spring setups.

Wednesday, March 13, 2013

Spring and Summer 2013 Long Term Forecast


 First things first - the March 15th - April 15th forecast for geopotential heights. Blue would suggest a cooler than usual atmosphere (from a lower 500mb level) and a red color would suggest a warmer than usual atmosphere (from a higher 500mb level). I ran a weighted average of my most similar years from my original November winter forecast (1952, 1967, 1970, 1978, 1979, 2009) up through April 30th. After April 30th, I have gone with a new list of years.


This forecast for geopotential height anomalies is a monthly index running from May 2013 through October 2013. My confidence at this time is low however I believe the large scale patterns (Pacific Decadal Oscillation, El Nino Southern Oscillation) will pan out very much similar to last summer. The new years chosen for my spring/summer index on similarity are 1952, 1967, 1979, and 2012.
My early concern is this blocking pattern showing up towards September (green over Greenland) - this is a similar pattern to what showed up last hurricane season.
1952 hurricane season
1967 hurricane season

1979 hurricane season

2012 hurricane season

Tuesday, February 26, 2013

January 30th Flooding Event Assessment

Last weeks flooding event may not been of a "historical worst" for the High Country but it did have its own circumstances that exasperated the flooding in the High Country anyway. The historical records since 1970 go to the dynamic duo of Hurricanes' Frances and Ivan in 2004. But where does this rain event stand with historical records? 


Snow Forecast 2013/02/26


Friday, February 1, 2013

February Archived Model Precipitation

This is my archived model precipitation outlook for each day in February, along with the daily mean temperature freezing line (dark blue line). Since the line represents the mean temperature, this can still mean the high exceeds the freezing point. A good rule of thumb is to assume the high and the low are 10-15* F apart from one another. So, it is best to be behind the freezing line for a higher probability of snowfall. The winters used are 1952, 1967,1970,1978,1979, and 2009. Rainfall is in mm/day. The high end is 25.4mm, which is the equivalent of 1" of rainfall.

Note that this model run is not going to be perfect and will have considerable inaccuracies. As Matt Parker from North Carolina State University says "All models are wrong. Some are useful." This model gives a good indication of what it has done historically for the most similar winters to this one, but does not necessarily imply the same pattern will show up. Rather, the larger scale teleconnection patterns are captured and unless small amplitude/high frequency patterns show up in multiple years, the small patterns are frequently dampened, if not removed entirely. Therefore, some patterns may still occur but be 1-4 days off from the actual pattern.

Wednesday, January 30, 2013

2013-01-30 Forecast Update


***Please note the time stamp is incorrect. The time shown on the animations should have +1 hours added on (for example, 2PM is really 3PM).***

Radar composite reflectivity forcast


Estimated rainfall (inches per hour)

Expected wind gusts (in knots)


Maximum wind speed


Visibility. A gray area is more likely to be fog, especially along the eastern slopes of the mountains
Updraft helicity. Helicity is the growth of horizontally oriented spin (a corkscrew motion). Upward helicity is the corkscrew spin growth in the vertical. Areas that are pinged are more likely to have squall line induced vortices that have a damaging wind component.

Monday, January 21, 2013

2013/01/23 Snow Forecast (Originally 1/20 forecast)


NAM Model Run 18Z

 
ECMWF snow projections, with the freezing line


Historically most similar storms with snow accumulations


Here we go with another snow producing system for this Friday. Note that with the presence of a weak warm layer aloft, there is a slight chance of sleet mixing in. The warm layer doesn't seem to be strong enough for freezing rain (complete melting), and we will not have the warm ground issue like our last system. Instead, what falls will likely stick right away. I expect this week to remain cold however there will be a short mild trend for next week. Late next week we get a harsh burst of cold air. For good measure, check this out: the plot was used from data I calculated back in November!