Tuesday, September 4, 2012

Is Hurricane Isaac a Prophecy?

Normally I don't dive into spirituality let alone try to use it to explain why certain meteorological phenomena happen. However, Hurricane Isaac has become a hot button topic due to its name and its path.

This is why I want to devote this blog post to the similarities that Isaac has with a certain "mystical" figure. This figure had an entire empire devoted to his cause, his strength, and his might. Entire legions feared the might and the power of Isaac. And the life cycle of Isaac is remarkably similar to this mystical figure.

This mystical figure......is Frieza.


Hurricane Isaac ruled the Caribbean and the Gulf of Mexico on its own, suppressing its true strength until just before landfall. Isaac had one of the lowest central pressures for a tropical storm that had not yet reached hurricane strength, at 976mb. Due to dry air entrainment into its central core, Isaac used its energy to expand its wind field and lower the pressure gradient between its center and the outside environment. A ragged eye kept forming and then collapsing due to the dry air entrainment. Tropical storms are warm core systems; the strongest winds are found at the lower/mid levels of the system instead of the upper level. Tropical cyclones derive their energy from the latent heat release from condensing water vapor. Water vapor condensing releases heat into the core, and this warmth exchange keeps the center of circulation buoyant to allow for more vertical growth. Since the bulk of latent heat release is in the lower/mid levels, the greatest temperature contrast between the core and the environment is at the lower/mid levels. Dry air encourages evaporation, and anyone who has gotten out of a shower before without a towel rapidly gets cold from heat being removed. Dry air cools the warm core nature of the system, and hence why it inhibited the wind field from contracting within Isaac.

Frieza had so much power that He himself could not control it, and thus transformed into a weaker state because He himself feared being unable to control his own power. This is one similarity that Isaac has with Frieza. Both kept their maximum power suppressed until just before the end.


Above: Isaac and Frieza in their weaker forms: the birth of two tyrants.

We saw many forms of Isaac, from a weakened tropical storm over Hispanola to a mid level category one hurricane at landfall. Frieza himself had many forms over his lifetime, each of which became more fearsome.

At the time of reckoning, Isaac made landfall on the southeast coast of Louisiana and drifted back out into the Gulf of Mexico before stalling just off shore for 12 hours. Goku himself had just five minutes to fight the Tyrant and put an end to his galactic conquest but this would take 20 episodes to complete.  And thus, Isaac maintained its peak intensity for much longer than those thought, due to its central core *finally* contracting. A contracting eyewall conserves its angular momentum when encountering rough surface friction (from land). Thus, Isaac was able to maintain its peak intensity despite land interaction. Isaac would bring a surge of power in the form of storm surge, despite appearing to only be a category one storm.
Frieza himself landed on a dry planet that would make it difficult to support life, just as Isaac had to contend with dry air penetrating its core. This planet was the planet Namek and He would search for eternal life with the Dragonballs


Isaac would put up a valiant fight with the land interaction, with an excellent outflow and plentiful moisture now pumping into its core. But Isaac alas, was being steered by a calm nature system, known as an upper level ridge. This ridge (Goku) would slowly but surely deprive Isaac (Frieza) of its power and might.


And it did. As Isaac moved farther away from the Gulf of Mexico, its source of power dwindled, and Isaac was downgraded to a tropical depression soon after.


The ridge (Midwest) that provided the steering currents for Isaac
 Even after losing most of its power, Isaac was still a threat and promoted heavy flooding inland Louisiana and Arkansas. Fortunately, the Mississippi River was at a low level when the rain fell, or otherwise the flooding would have been far worse along the river.

The circulation of Isaac was ripped in half by an upper level trough. Half of the circulation was carried along with the parent trough while the lower half would be removed entirely from the trough and left behind. This would be the last we heard from Isaac.

The Dragonballs were used to send everyone but Goku and Frieza back to Earth, leaving the two stranded on a dying planet to battle it out! Frieza for a time contended against Goku but He would falter and weaken. Goku decided to call off the fight, but Frieza would not. Unfortunately for Frieza, he would be sliced in half and left to die.


 Isaac was no more. Frieza was no more. But left behind were memories of the suffering and destruction each left behind.

But alas, this would not be the end of either.
The split! Southern circulation of Isaac (over Alabama) and northern circulation (over Ohio)
The split! Frieza is sliced in half!

Frieza would be discovered nearly dead floating in space, when He was picked up by none other than King COLD himself. He would be put into a rejuvenation chamber and rebuilt. He would become faster and stronger than he was before. Incidentally, Goku's warm hearted nature in sparing Frieza's life would come back to haunt him.

Isaac was left to dissipate over Missouri/Illinois/Indiana, having merged with an upper level trough. It would seem that its identity would be lost forever. However a COLD core cutoff low approaching Florida would help steer the remaining circulation back towards the Gulf of Mexico. Incidentally, the lack of shear within the upper level ridge steering Isaac inland would be what kept the lower/mid circulation intact.

The COLD core low, what helped the remnant southern half of Isaac to move back towards the Gulf of Mexico


King COLD, who saved the remains of Frieza and saved His life.

Frieza would be made faster and stronger than before. Isaac is now moving back out over the Gulf of Mexico. Whether it will be renamed Isaac or named a new system entirely is the question, but one thing remains. A piece of Isaac is alive. And there are projections that it may reform back into a depression status.

However this depression is projected to not last very long and be ripped to pieces, never to be brought back again (except to send heavy rain back over Florida.

The southern fragment of Isaac, moving back out over the Gulf of Mexico.
Isaac two day projection (closed low over the Gulf)

And by day 5, Isaac is cut to pieces by a strong approaching trough, making its resurrection short lived.
And Frieza is cut to pieces, by a super saiyan named Trunks, making His resurrection short lived.


Monday, August 27, 2012

Issac Forecast Update


Primary threat: Freshwater flooding, heavy rainfall, down tree limbs and power lines, high storm surge east of the Mississippi Delta based on topography

Secondary threat: high wind damage


Lets cut to the chase.

Soon to be Hurricane Issac is taking a very dangerous path towards Louisiana. At the current track it will make landfall right at the Mississippi River Delta. This is farther east than Hurricane Gustav made landfall, and Issac will likely make landfall at a slightly weaker intensity (and slower forward speed) than Gustav. However, the landfall location at this time has made for near optimal storm surge heights for eastern Louisiana and Mississippi due to the storm making landfall almost perpendicular to the coast. The next few figures below show the maximum surge potential for the optimal state, at various strengths. Pay additional attention to those that are specially marked in the captions.


Surge potential for a high end cat 1 (winds 90mph) in between low tide and high tide, with the storm moving onshore at a forward speed of 10mph. *MOST LIKELY SCENARIO***
Surge potential for a high end cat 1 (winds 90mph) at high tide, with the storm moving onshore at a forward speed of 10mph. ***MOST LIKELY SCENARIO***

If the land is covered by something, then it means that either a surge or rain water has predicted these areas will be flooded. I have set the color bar to be the same for all three maps. Even the cat 1 scenario is ugly but this storm looks strikingly familiar to what Gustav did in 2008. Issac makes landfall slightly eastward and puts a 10ft storm surge that is not usually seen for a cat 1 storm, due to the topography. I would look for a blend between the first map and the second map above for potential surge but there is still great uncertainty between now and the landfall. This is because Issac has picked an unfortunately bad storm track, where it will be making landfall almost perpendicular to the eastern Louisiana shoreline. I lowered the forward speed to 10mph at landfall, but Issac will have a threat that Gustav did not have: extremely heavy rainfall along the coast. Lets compare Gustav (2008) and the model output for Issac (2012).

 
Gustav rainfall
Issac's rainfall projections

Issac is interacting with a pre-existing stationary front boundary, which is why high rainfall spreads into Georgia and the Carolinas despite the storm not being anywhere near those locations. This unfortunately slows the storm down to a crawl after landfall. At this time I think rainfall will actually be between 75% and 80% of what is shown above.


And all of today (Monday) where Issac failed to increase its maximum winds but still had a pressure drop produced a wider wind field.


The semicircle near the center of the picture signals that an eye is starting to form. Dry air along the northern quadrant is still interfering with a complete eye from forming
The image above is not a surprise: Issac has struggled to form a complete eye for the past 24 hours due to entrainment of mid level dry air. Issac may still have another 12 hours before it walls off the dry air. Thank goodness the dry air is there or otherwise Issac would already be a cat 2 hurricane. In the very last image of the animation we see an eye emerging.


Model runs for storm path of Issac.

Please be safe if you are along the Gulf Coast.


Monday, August 13, 2012

Update: Winter Prediction


Height anomalies for the next 10 days. Red = warm, blue = cold. Notice the persistent warm anomaly over Southeast Canada (white box) and the resulting cooler weather (blue box). This may be a pattern setting up for the long term. 6/8 winters listed below had this pattern leading into it.


The Pacific Decadal Oscillation failed to switch into a positive phase and is dropping back into a medium negative phase. The warm phase of ENSO has also weakened, but significant upwelling of warmer water will re-energize El Nino conditions. Originally I thought we would be sitting in a very easterly oriented El Nino, but by the time winter rolls around, El Nino will be more oriented towards the central Pacific. The neutral orientation of ENSO will partially offset the negative phase of the PDO. I have pulled several winters that exhibited a medium negative phase PDO and a weak neutral to slightly easterly oriented ENSO. The conditions I have used are unique. I did a 3-month running mean of both the PDO and ENSO, and those winters that had a 3-month running mean of the above conditions were used. Also, 3/5 months out of December - April (April being the wild card) had to meet the appropriate conditions as well (in actuality, Dec - Mar are the critical months).

Winter of 1951 - 1952: 23" of snow
Winter of 1952 - 1953: 22" of snow
Winter of 1953 -1954: 9" of snow
Winter of 1963 - 1964: 76" of snow 

Winter of 1968 - 1969: 84" of snow
Winter of 1978 - 1979: 51" of snow
Winter of 1989 - 1990: 29" of snow
Winter of 2006 - 2007: 16" of snow


63-64, 68-69, and 78-79 have inflated values due to a slight southerly shifted storm track that gave rise to snow from Gulf Low storms instead of rainfall. Despite these inflated values, I am using these years for temperature/precipitation anomalies, but will omit these years for snow observations.


Weather Advance predicted storm track, which I am in agreement with (shift the purple line slightly farther inland up to Cape Hatteras).

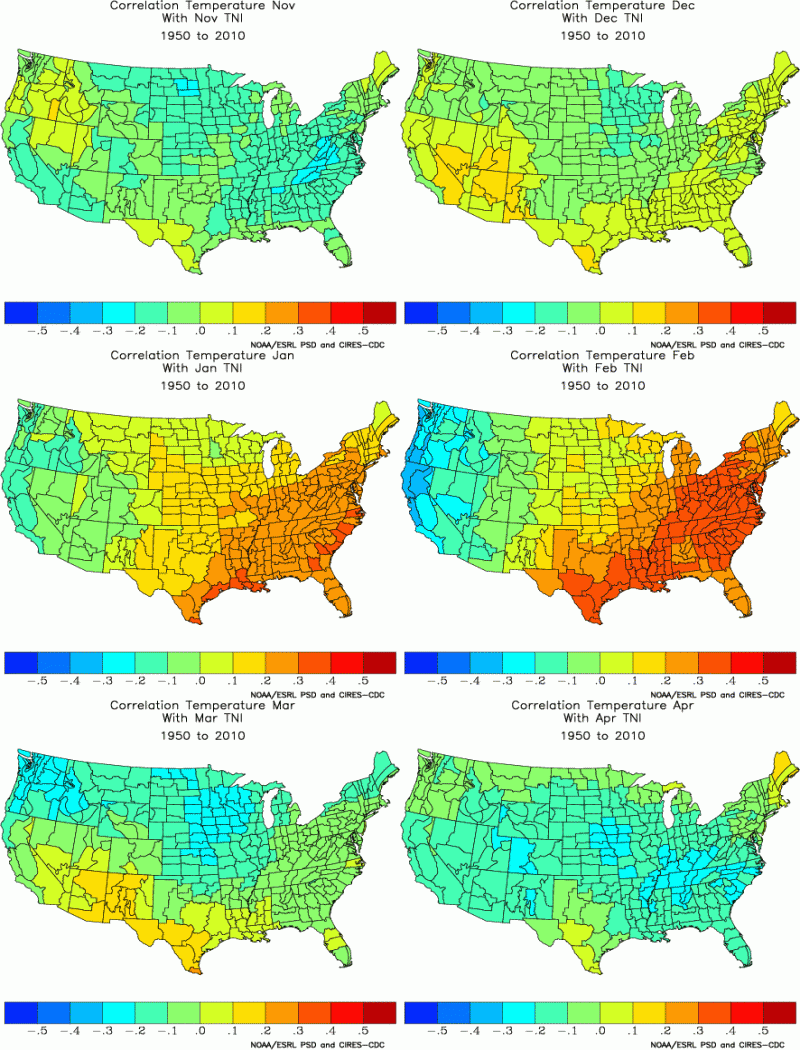
So below I have correlation plots of the Multivariate ENSO Index (MEI), Pacific Decadal Oscillation, and Trans-Nino Index compared to precipitation and temperature.


Correlation of Multivariate ENSO Index with precipitation
Long story short, but an El Nino makes it wet for the south and dry for the north.

Correlation of Multivariate ENSO Index with temperature
 Long story short, but an El Nino makes it cool for the south and warm for the north.

Correlation of Pacific Decadal Oscillation with precipitation
 Long story short, but a negative phase PDO makes it wetter west of the Appalachian Mountains and slightly drier east of the Appalachian Mountains. The correlation is lower early/late season, and the greatest impact is going to be west of the Appalachian Mountains.
Correlation of Pacific Decadal Oscillation with temperature
  Long story short, but a negative phase PDO makes it warmer across the Southeast. The correlation is lower early/late season.


Correlation of Trans-Nino Index with precipitation
   Long story short, but an easterly oriented ENSO slightly wetter across the Southeast but drier across the Deep South. The correlation is lower for precipitation and really is only pertinent for January and February.
Correlation of Trans-Nino Index with temperature
   Long story short, but an easterly oriented ENSO slightly warmer across the South and East coast but cooler for the west coast. The correlation is lower for temperature and really is only pertinent for January and February.

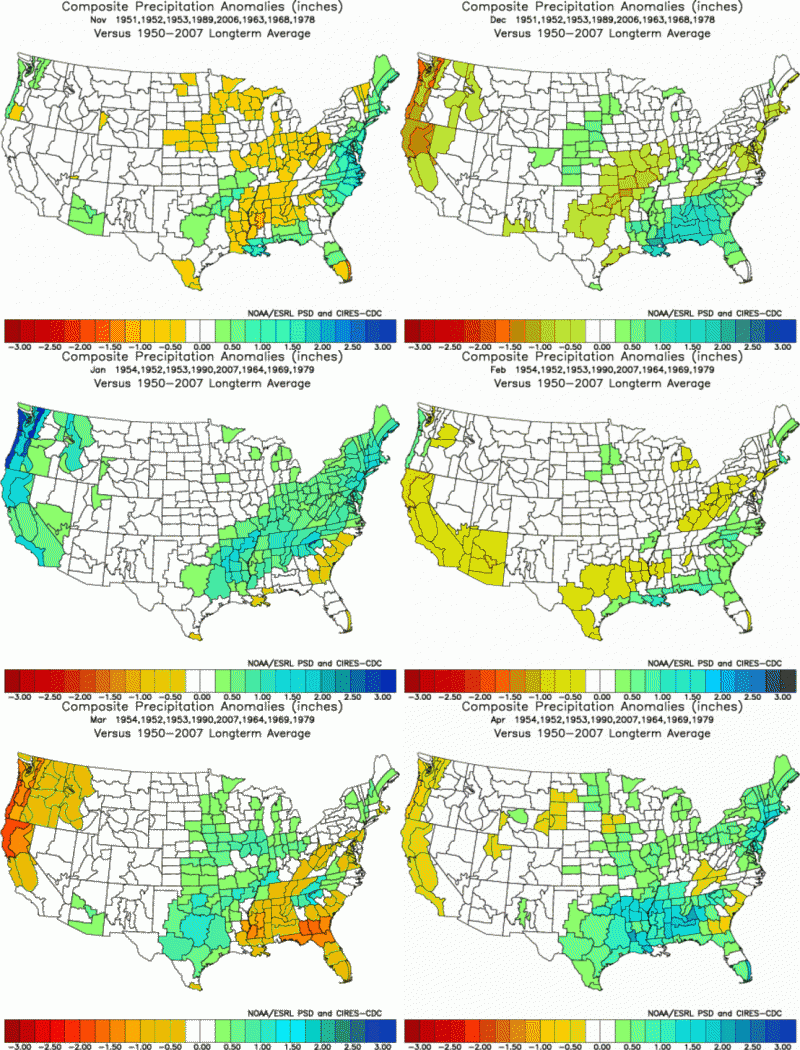
Mean of precipitation anomalies for winters most like our upcoming winter
And we put it all together for relevant winters, and we get our precipitation anomalies (in inches) per month for what is projected for this upcoming winter. It will be very wet along the Gulf Coast, Deep South, and Mid-Atlantic, but dry across the Ohio River Valley and the Midwest. An active Alberta Clipper track early on saves the interior of the Northeast early this winter.

Mean of temperature anomalies for winters most like our upcoming winter

And we put it all together for relevant winters, and we get our temperature anomalies (in fahrenheit) per month for what is projected for this upcoming winter. It will be a very quick and cool start for our winter, with an abrupt warming trend in January for the eastern portion of the United States. The Southeast has a cool start and escapes the bulk of the warm temperatures in January. They are just slightly above normal for January. Overall the Southeast will have near normal to slightly above average snowfall for this winter and the Mid Atlantic will have above average snowfall. The Northeast will be warmer the second half of this winter but will see near normal snowfall amounts. Lake Effect snow will be plentiful this year with the active Alberta Clipper Track and an anomalously warm Great Lakes. The upper Midwest sees a large decline of snowfall this winter. The central and southern Rockies and Sierra Nevada see higher snowfall.


I do support a near average to slightly above average snowfall amount for the rest of our state, and above average snowfall for the majority of the Southeast. The Appalachian Mountains straddle the zone between drier/wetter for the Southeast. Higher snow density may cut down total accumulations though, especially with a more active southern storm track. Lake Effect snowfall will be higher especially with the anomalously warm temperatures the lakes already have. High pressure anomaly over southeast Canada may be here for the long haul. My approach got me 33" of snow using a running mean method and a per month method got me 36" of snow for the winter. A lot depends on the wild card and that is the strength of the Polar Vortex


Sunday, July 29, 2012

2012-2013 Winter Prediction Part II


I have some animations below what pattern we are going towards. These plots represent an average of several years over a 60 year time interval (1950-2010). I used some criteria to choose my years.

1)An easterly oriented El Nino or neutral ENSO, with a positive Trans-Nino-Index (greater than 0)
2)Nino 1+2 value less than or equal to 1.5, and greater than or equal to -0.25
3)No Nino value (Nino 1+2, Nino 3, Nino 4, Nino 3.4) may exceed +2, or fall below -1
4)A weak negative Pacific Decadal Oscillation (greater than -0.5) to a moderately strong positive PDO (less than +1.5).
5)Months covered are December, January, February, and March

So out of all the criteria, I am left with 36 months worth of data. For my ideal scenario, which has a tighter range of acceptable values, I only have 17 months fitting the bill. I will have two types of animations below: one for the wider criteria and one for the narrower one.
Wind Vectors for wide criteria

Wind Vectors, small criteria

Vector wind, zoomed in. A lot of our storms will skirt off the coast to start our winter.

Geopotential height anomalies, wide criteria
Geopotential height anomalies, small criteria. This points to a slow start to our winter.

Vorticity for wide criteria. Vorticity measures the spin in the atmosphere. What we see is a very active Alberta Clipper track and a developing subtropical track, but we are not finding our vorticity maximum riding along the east coast until late January/early February.
Hang on, notice the persistence of that vorticity signature over the Midwest? This is actually a diminished Colorado Low storm track. I don't think lee cyclogenesis east of Colorado is the reason for this but rather is a deepened trough on the Alberta Clipper storm track or an ascending subtropical branch instead (FAR more likely the ascending branch idea). This is dropping into the Midwest, and these storms are likely to be ice storm producing rather than just pure snow in nature. The storm here is a wild card: it may end up following the track farther north or will degenerate west of the Appalachian Mountains, only to reform east of the Carolinas. I don't see this being a primary track for any month but will be a consistent secondary track during all winter months.

According to the winters MOST like this predicted one (on a record from 1950-2012), the average snow total was 29" of snow for Boone, with a range from 18" to 56" of snow. With the wider margin the average snowfall for this kind of winter would be 33.3" of snow, with a range from 18" to 71". But, the blizzard of 93 heavily skewed that 71" measurement. Most notably, I had quite a few of these winters hover around a very tight gradient. My 25th and 75th percentile were 25" to 36".

Prediction: this winter will have above normal precipitation with near normal to slightly below normal temperatures, with a very slow start to our winter. Due to insufficient synergy of the polar jet and the subtropical jet until the last half of winter, snow totals for Boone, NC will hover around the 25-30" mark, +/- 5" of snow. That is still a wide gradient but we are still several months away from winter.


Saturday, July 28, 2012

2012-2013 Winter Prediction

At this point, I would be lying if I said I was completely confident in what this upcoming winter is going to do. After getting hosed for last winter's forecast (the snowy start turned out to be a very warm, wet start), I have learned a great deal more to what is entailed with long term climate predictions. Indeed, about the only thing I got right last winter was the "high precipitation, active storm track" part.

But another year has passed and I spent the better part of that year with some of the most gifted minds at NC State University. I learned of new indices, new techniques, and more importantly, got a better understanding of the working mechanics of the atmosphere. The past year was a year well spent.

We have several indices which can be tracked on a longer term scale than others. These longer (6-month to multi-year time scale) anomalies paint a very fuzzy image of what this winter will bring for us. Then we have shorter term anomalies which act as the wild cards for how our winter will progress. Basically, these longer term anomalies are like the tide on the beach while the shorter term anomalies are like each individual wave crashing onshore.

I don't mean to have such a long prelude, but there is much to look at with such a winter forecast. Please, fasten your seatbelts for "L'Heureux's Winter Forecast" ride and keep your arms and legs in the vehicle at all times.

I will be using some terminology in this article, but I have a resource page available that break down each variable here:

http://www4.ncsu.edu/~jmlheure/index6.html


We have heard of the El Nino/La Nina cycle before, but we have different indices to measure the El Nino Southern Oscillation (will be called ENSO from here on out). In the image below are four samples of ENSO based indices: Nino 1+2, Nino 3, Nino 3.4, and Nino 4.


  The sector that is of most interest to us is Nino 3.4. Nino 3.4 has the most influence on transferring the anomalies caused by a weakened/reversed equatorial winds to the Southeast. Nino 1+2 would exhibit the greatest negative temperature anomaly for Florida, Nino 3 would have a greater effect on the Gulf Coast, Nino 3.4 would push the extent into the Southeast and Deep South, and Nino 4 would show the most anomalies for Texas and the Deep South. Conversely, positive temperature anomalies would span from the Great Lakes for Nino 1+2, to the upper Midwest for Nino 4.

Which, brings me to my first point. We are entering into a weak El Nino, but it's an EASTERLY based El Nino (Nino 1+2). I project that the El Nino will soon include Nino 3 but will remain near neutral to slightly weak El Nino for Nino 3.4 and Nino 4 for the early part of winter. That means that Florida and the Gulf Coast may see a very rainy, cool start right off the bat but otherwise we may have a slow start to this winter.


Our second long term variable, the Pacific Decadal Oscillation. We have been in a very negative PDO phase for the past year, and have been riding a negative PDO for the past 3 years (with the exception of the 2009-2010 winter, and we know how that one turned out).

Positive PDO temperature anomalies

PDO index (since the year 2000)


The PDO is trending positive, although very slowly. The most recent PDO index number for June was -0.87. For July it should be slightly greater since the Central Pacific Ocean's temperature anomalies have started to decrease in intensity. A + PDO allows for cooler weather to settle across the East Coast. A -PDO hurts our chances for cooler weather, since it indirectly promotes a more zonal flow entering into the Pacific Northwest. That killed us last winter. A +PDO indirectly promotes a storm track that digs farther south into the United States (and conversely, a storm track that pushes much farther north in the Pacific Basin).

We are likely to move towards a near neutral to a slightly +PDO this winter, although the setup is going very slowly and with a lag time between the PDO and influences farther downstream (United States), we are unlikely to see a beneficial weather pattern for cold/snow until later in the winter.

Conclusion: We will have a sluggish start to our winter, with both an easterly oriented El Nino and a slowly warming central Pacific Ocean. Remember that these are long term teleconnection patterns and the shorter term patterns will be our wild cards, making this sway either way (colder or warmer). Florida will have an unusually wet and cool start to the winter due to the strong subtropical jet influence. The PDO will not come into full play until mid winter, where we will see a cooling effect over the east coast. The snow track in early winter will be over the Ohio River Valley/Great Lakes and the split storm track will inhibit large scale snow storms. The storm track will become very active the second half of winter for the Mid-Atlantic. Cyclogenesis will be very prevalent in the Gulf of Mexico throughout winter but will be limited to smaller, weaker disturbances in the early part of winter due to the decoupled subtropical/polar jet stream. Cyclongenesis from an easterly based El Nino may carry storms away from the Atlantic Coast and preventing an interface with the polar jet. This would hurt our snow chances, especially with an already cold stratosphere giving us a stronger polar vortex. When the PDO starts to influence the polar jet in a positive manner, we will see larger systems start to track up the Mid-Atlantic coast. But for the first half of winter, we will see many storms simply track off the coast altogether, with the northern snow track being weak with numerous alberta clipper systems.

Verdict: Slow start to the winter, possibly cool/wet (limited snow), increasingly favorable conditions set us up for less frequent, but stronger synoptic storms the second half of winter, with better snow chances. Likely to be consistently cool (chilly) and wet. Storms are more likely to start tracking up the coast the second half of winter. Snow totals estimated to be near normal to slightly below normal, even with the El Nino setup (due to the decoupled subtropical/polar jet). A slow transition to more favorable central and equatorial Pacific conditions with an already cold stratosphere (strong polar vortex) may keep many storms from maturing early on. Deep South and the Ohio River Valley benefit from the easterly ENSO setup, due to a better chance of jet streams getting within close enough proximity to put a cold sector with the storm systems.

Vorticity correlation plots


To proceed to part II, click below:


http://lheureuxsweather.blogspot.com/2012/07/2012-2013-winter-prediction-part-ii.html