Sunday, July 29, 2012

2012-2013 Winter Prediction Part II


I have some animations below what pattern we are going towards. These plots represent an average of several years over a 60 year time interval (1950-2010). I used some criteria to choose my years.

1)An easterly oriented El Nino or neutral ENSO, with a positive Trans-Nino-Index (greater than 0)
2)Nino 1+2 value less than or equal to 1.5, and greater than or equal to -0.25
3)No Nino value (Nino 1+2, Nino 3, Nino 4, Nino 3.4) may exceed +2, or fall below -1
4)A weak negative Pacific Decadal Oscillation (greater than -0.5) to a moderately strong positive PDO (less than +1.5).
5)Months covered are December, January, February, and March

So out of all the criteria, I am left with 36 months worth of data. For my ideal scenario, which has a tighter range of acceptable values, I only have 17 months fitting the bill. I will have two types of animations below: one for the wider criteria and one for the narrower one.
Wind Vectors for wide criteria

Wind Vectors, small criteria

Vector wind, zoomed in. A lot of our storms will skirt off the coast to start our winter.

Geopotential height anomalies, wide criteria
Geopotential height anomalies, small criteria. This points to a slow start to our winter.

Vorticity for wide criteria. Vorticity measures the spin in the atmosphere. What we see is a very active Alberta Clipper track and a developing subtropical track, but we are not finding our vorticity maximum riding along the east coast until late January/early February.
Hang on, notice the persistence of that vorticity signature over the Midwest? This is actually a diminished Colorado Low storm track. I don't think lee cyclogenesis east of Colorado is the reason for this but rather is a deepened trough on the Alberta Clipper storm track or an ascending subtropical branch instead (FAR more likely the ascending branch idea). This is dropping into the Midwest, and these storms are likely to be ice storm producing rather than just pure snow in nature. The storm here is a wild card: it may end up following the track farther north or will degenerate west of the Appalachian Mountains, only to reform east of the Carolinas. I don't see this being a primary track for any month but will be a consistent secondary track during all winter months.

According to the winters MOST like this predicted one (on a record from 1950-2012), the average snow total was 29" of snow for Boone, with a range from 18" to 56" of snow. With the wider margin the average snowfall for this kind of winter would be 33.3" of snow, with a range from 18" to 71". But, the blizzard of 93 heavily skewed that 71" measurement. Most notably, I had quite a few of these winters hover around a very tight gradient. My 25th and 75th percentile were 25" to 36".

Prediction: this winter will have above normal precipitation with near normal to slightly below normal temperatures, with a very slow start to our winter. Due to insufficient synergy of the polar jet and the subtropical jet until the last half of winter, snow totals for Boone, NC will hover around the 25-30" mark, +/- 5" of snow. That is still a wide gradient but we are still several months away from winter.


Saturday, July 28, 2012

2012-2013 Winter Prediction

At this point, I would be lying if I said I was completely confident in what this upcoming winter is going to do. After getting hosed for last winter's forecast (the snowy start turned out to be a very warm, wet start), I have learned a great deal more to what is entailed with long term climate predictions. Indeed, about the only thing I got right last winter was the "high precipitation, active storm track" part.

But another year has passed and I spent the better part of that year with some of the most gifted minds at NC State University. I learned of new indices, new techniques, and more importantly, got a better understanding of the working mechanics of the atmosphere. The past year was a year well spent.

We have several indices which can be tracked on a longer term scale than others. These longer (6-month to multi-year time scale) anomalies paint a very fuzzy image of what this winter will bring for us. Then we have shorter term anomalies which act as the wild cards for how our winter will progress. Basically, these longer term anomalies are like the tide on the beach while the shorter term anomalies are like each individual wave crashing onshore.

I don't mean to have such a long prelude, but there is much to look at with such a winter forecast. Please, fasten your seatbelts for "L'Heureux's Winter Forecast" ride and keep your arms and legs in the vehicle at all times.

I will be using some terminology in this article, but I have a resource page available that break down each variable here:

http://www4.ncsu.edu/~jmlheure/index6.html


We have heard of the El Nino/La Nina cycle before, but we have different indices to measure the El Nino Southern Oscillation (will be called ENSO from here on out). In the image below are four samples of ENSO based indices: Nino 1+2, Nino 3, Nino 3.4, and Nino 4.


  The sector that is of most interest to us is Nino 3.4. Nino 3.4 has the most influence on transferring the anomalies caused by a weakened/reversed equatorial winds to the Southeast. Nino 1+2 would exhibit the greatest negative temperature anomaly for Florida, Nino 3 would have a greater effect on the Gulf Coast, Nino 3.4 would push the extent into the Southeast and Deep South, and Nino 4 would show the most anomalies for Texas and the Deep South. Conversely, positive temperature anomalies would span from the Great Lakes for Nino 1+2, to the upper Midwest for Nino 4.

Which, brings me to my first point. We are entering into a weak El Nino, but it's an EASTERLY based El Nino (Nino 1+2). I project that the El Nino will soon include Nino 3 but will remain near neutral to slightly weak El Nino for Nino 3.4 and Nino 4 for the early part of winter. That means that Florida and the Gulf Coast may see a very rainy, cool start right off the bat but otherwise we may have a slow start to this winter.


Our second long term variable, the Pacific Decadal Oscillation. We have been in a very negative PDO phase for the past year, and have been riding a negative PDO for the past 3 years (with the exception of the 2009-2010 winter, and we know how that one turned out).

Positive PDO temperature anomalies

PDO index (since the year 2000)


The PDO is trending positive, although very slowly. The most recent PDO index number for June was -0.87. For July it should be slightly greater since the Central Pacific Ocean's temperature anomalies have started to decrease in intensity. A + PDO allows for cooler weather to settle across the East Coast. A -PDO hurts our chances for cooler weather, since it indirectly promotes a more zonal flow entering into the Pacific Northwest. That killed us last winter. A +PDO indirectly promotes a storm track that digs farther south into the United States (and conversely, a storm track that pushes much farther north in the Pacific Basin).

We are likely to move towards a near neutral to a slightly +PDO this winter, although the setup is going very slowly and with a lag time between the PDO and influences farther downstream (United States), we are unlikely to see a beneficial weather pattern for cold/snow until later in the winter.

Conclusion: We will have a sluggish start to our winter, with both an easterly oriented El Nino and a slowly warming central Pacific Ocean. Remember that these are long term teleconnection patterns and the shorter term patterns will be our wild cards, making this sway either way (colder or warmer). Florida will have an unusually wet and cool start to the winter due to the strong subtropical jet influence. The PDO will not come into full play until mid winter, where we will see a cooling effect over the east coast. The snow track in early winter will be over the Ohio River Valley/Great Lakes and the split storm track will inhibit large scale snow storms. The storm track will become very active the second half of winter for the Mid-Atlantic. Cyclogenesis will be very prevalent in the Gulf of Mexico throughout winter but will be limited to smaller, weaker disturbances in the early part of winter due to the decoupled subtropical/polar jet stream. Cyclongenesis from an easterly based El Nino may carry storms away from the Atlantic Coast and preventing an interface with the polar jet. This would hurt our snow chances, especially with an already cold stratosphere giving us a stronger polar vortex. When the PDO starts to influence the polar jet in a positive manner, we will see larger systems start to track up the Mid-Atlantic coast. But for the first half of winter, we will see many storms simply track off the coast altogether, with the northern snow track being weak with numerous alberta clipper systems.

Verdict: Slow start to the winter, possibly cool/wet (limited snow), increasingly favorable conditions set us up for less frequent, but stronger synoptic storms the second half of winter, with better snow chances. Likely to be consistently cool (chilly) and wet. Storms are more likely to start tracking up the coast the second half of winter. Snow totals estimated to be near normal to slightly below normal, even with the El Nino setup (due to the decoupled subtropical/polar jet). A slow transition to more favorable central and equatorial Pacific conditions with an already cold stratosphere (strong polar vortex) may keep many storms from maturing early on. Deep South and the Ohio River Valley benefit from the easterly ENSO setup, due to a better chance of jet streams getting within close enough proximity to put a cold sector with the storm systems.

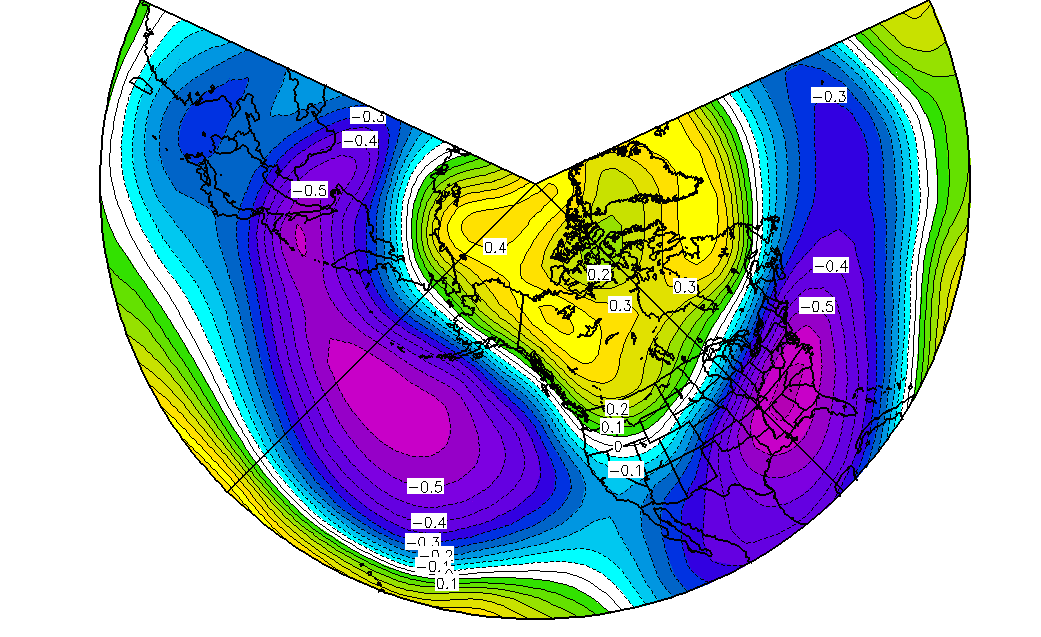
Vorticity correlation plots


To proceed to part II, click below:


http://lheureuxsweather.blogspot.com/2012/07/2012-2013-winter-prediction-part-ii.html


Thursday, July 26, 2012

New York Severe Storms


Base scan doppler radar image

Composite Doppler scan. Ignore the rings around the radar. The higher reflectivity values in the squall line reflect that there is a lot of water suspended aloft


Wind velocity, shown in knots. 60knots is about 70mph.

Diamond = mesovortex signature (rotating thunderstorm). These along a squall line edge can produce additional damage. Purple triangle = tornado vortex signature.
Cloud water content

Maximum cloud height. Yes, the one in the head of the squall line is at 57,000ft

Tuesday, July 24, 2012

Quick Forecast

The next four slides are from the Storm Prediction Center

Severe storm probability

Hail probability

Tornado probability

Damaging wind probability


Basically, when you are in this red box below, this is when the low level jet is in a position to generate a strong to severe thunderstorm over you. Storms may produce damaging winds today, with hail and weak, isolated tornadoes being a secondary risk for areas on the right side of the box. The original wind profile for the 700mb level is from twisterdata.


Wednesday, July 18, 2012

Why has it been so warm?


I think it is important to introduce the main game players here. The first would be the El Nino Southern Oscillation (ENSO). For those of us new to the climate world, ENSO is a sea surface temperature anomaly in the Pacific Ocean induced by both 1)Oceanic currents 2)Atmospheric wave patterns. Shown below is the Multivariate ENSO Index (MEI), which takes into account several variables for the ENSO phase. Red = El Nino Blue = La Nina. Neither pattern has a significant climatological change on AVERAGE temperatures; indeed there have been very cold La Nina winters (1959-1960) and very warm La Nina winters (2011-2012). A La Nina allows for a more meridional flow though, which translates to a wider range of temperatures.

Remember the 2009-2010 Armageddon winter; it may have been very cold and snowy, but it was CONSISTENTLY cold and snowy. The winter after (2010-2011) is remembered for it's abrupt start and it's even more abrupt finish.


We get to our second player, the Pacific Decadal Oscillation. As its name suggests, it exists on a multi-year scale. Shown below is an image from Wikipedia depicting a positive (warm phase) of the PDO. This is a sea surface temperature anomaly. A negative phase of the PDO would be very conducive for warmer weather across the Southeast. Note that both the 2010-2011 and 2011-2012 winters were a negative phase PDO. But 2010-2011 was a far cry from the near record low of 2011-2012 winter.


Dec - Feb 1980 - 2010 PDO correlation to 500mb height levels
The negative event of 2010 - 2011 was weak enough to be overpowered by another variable, the Arctic Oscillation, thus giving us a very cold start despite the unfavorable conditions in the Pacific. But in 2011-2012, the PDO was much stronger and limited the number of cold air outbreaks we received. Switching gears away from the 2011-2012 winter, we go to this summer.

Dec - Feb 1980 - 2010 PDO correlated to temperatures.
This is why we never stood a chance for a cold 2011-2012 winter.


Summertime PDO correlated to geopotential height. Note that we are still within a negative phase of the PDO.


Summertime PDO correlated to temperatures. Note that we are still within a negative phase of the PDO.

Summertime PDO correlated to zonal winds. This actually fits what we have seen so far: a lack of a subtropical jet influence over the Southeast and a stronger zonal flow over the northern tier of the United States.
 The equalizing factor. We have been moving towards a weak El Nino (started off with a La Nina spring). The zonal flow into the Pacific Northwest and over the northern tier of the United States is weakened during an El Nino.

 Put the -PDO with an El Nino and the effects start to cancel out. However, since there is a lag for when an El Nino develops and when it influences our weather, we are unlikely to see its impacts until the second half of summer. Conversely, since we have been in a long trending -PDO, we are already seeing those effects now.

And believe it or not, this summer could be far hotter. We haven't seen much intrusion from the Bermuda High to our east. If we were, we would see a much hotter and moisture loaded air mass. Instead, the Midwest and the Northeast are taking the bulk of the heat. We can thank the -NAO for keeping the Bermuda High at bay.


Verdict: Despite a hot start to our summer, it will become a little cooler and much rainier for the second half.

SNOWFALL
Winter snowfall actually has some ramifications over spring time and to a lesser extent, summertime conditions as well. With a lack of snowfall during the winter, temperature cold sectors are not as able to get established. That's why it flat out never stayed cold across the United States this winter. There was a lack of a snowpack to speak of. Below shows the snowfall anomalies from December 1st, 2011 to March 1, 2012. Red = deficit, Blue = surplus.

Snow coverage anomalies from 2011 - 2012.
 Speaking of a tale for two winters, Europe was struggling to get ANY snowfall for the first half of the winter, only to get hammered the second half.
2010-2011 snow coverage December 1st - April 30th

2011-2012 snow coverage December 1st - April 30th


Ouch. That last animation is just painful to look at.

There is something I have been saying since January, and it's that this winter was very good for the Arctic. This was indeed true, as there was a higher amount of sea ice over the Arctic since at least 2007 and was near the normal for 1979-2000 mean. However, there was a large degree of ice retreat in June. The less ice over the Arctic, the lower the albedo (reflectivity), meaning more energy from the sun is absorbed at the surface rather than reflected. Meaning...warmer temperatures!!!


And this is getting into unfamiliar territory, but we were at a sunspot minimum for the 2009-2010 winter. I am not that familiar with this area, but from my understanding a sunspot minimum means a less solar energy reaching Earth. We are near the crest of a sunspot maximum now.

Monday, July 2, 2012

July 1st Squall Line

Circled areas = damaging wind reports, blue squares = large hail. Note the lack of reports for the last half of the animation corresponds to it being late at night. Now, here is a challenge, not to just the readers, but to the community as well. To benefit the scientific community, one needs to send in weather reports to official sources, such as the National Weather Service or the Storm Prediction Center. Information sent to Watauga Road Conditions and Avery Road Conditions also need to be sent to the National Weather Service. The more reports we have, the better quality of data we can have for forecasting for future storms.

The more reports the community can send out, the more often I will produce animations like the one below (and the one from the 06/29/12 derecho).